echarts——tooltips动态循环展示+柱状图动态循环展示
最近在做看板,用的是echarts做的。遇到一些内容,做个笔记记录一下。
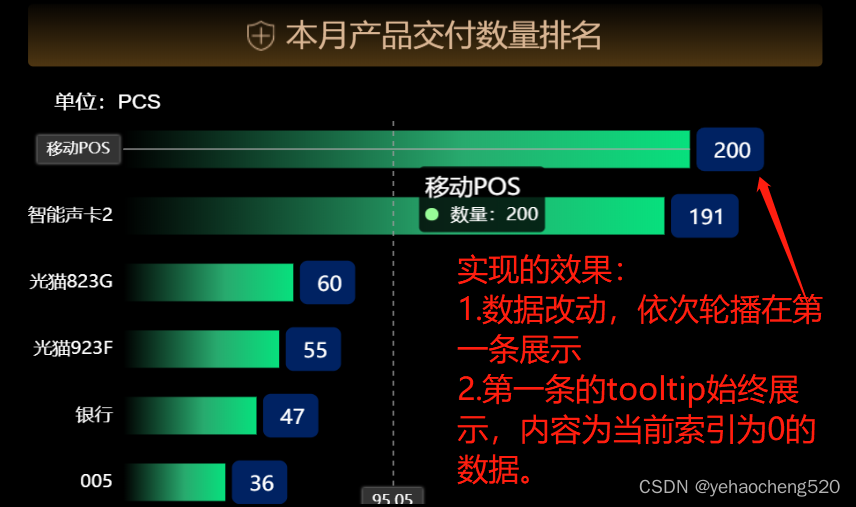
1.tooltips动态循环展示——数据不动,toolTip索引改变

上代码:
1.1 options中需要有tooltip
tooltip: {
    trigger: "axis",
    axisPointer: {
        // 坐标轴指示器,坐标轴触发有效
        type: "shadow" // 默认为直线,可选为:'line' | 'shadow'
    }
},
由于此部分数据不动,只需要循环改变toolTip的索引即可实现动态循环展示了
1.2 写个方法,定时改变dataIndex值,就是当前展示tooltip的索引
var currentIndex = -1;
setInterval(() => {
    var dataLen = data.length;
    echartsId.dispatchAction({
        type: 'downplay',
        seriesIndex: 0,
        dataIndex: currentIndex
    });
    currentIndex = (currentIndex + 1) % dataLen;
    echartsId.dispatchAction({
        type: 'highlight',
        seriesIndex: 0,
        dataIndex: currentIndex,
    });
    echartsId.dispatchAction({
        type: 'showTip',
        seriesIndex: 0,
        dataIndex: currentIndex
    });
    // console.log(currentIndex)
}, 3000)
2.数据动态改变——toolTip跟随改变

下面代码中:
1. source2 是数据源,有多条,要求每次都动态展示其中的6条。
2. 思路:先数组末尾添加第一条,然后splice去掉第一条,然后截取前6条数据。
3. 定时器循环,为了保证源数据不被污染,可以通过扩展运算符进行赋值数据。
4. column2:是echarts.init('dom'元素);之后的内容,只要是做过echarts的都明白的。
5. column2Draw:是options配置参数。这个基本上可以参考官网上的配置。
6. 一定要用setTimeout延时一下,不用写延时时间,否则会有部分数据不展示toolTip,有些展示。加个延时就解决了
 var column2 = echarts.init(document.getElementById("target-bar1-right"));
 column2.setOption(column2Draw);
let barTimer = setInterval(() => {
   source2.push(source2[0]);
    source2.splice(0, 1)
    let data = [...source2];
    var newarr1 = data.splice(0, 6);
    column2Draw.dataset.source = newarr1;
    column2.setOption(column2Draw);
    showTooltips(column2,newarr1);
}, 3000)

function showTooltips(echartsID,data){
    setTimeout(function () {
        var currentIndex = data.length-1;//由于要求数据逆序,所以第一个也就是数据的最后一个了,如果数据没有要求逆序展示,则此处可以将currentIndex直接写为0,
        echartsID.dispatchAction({
            type: 'showTip',
            seriesIndex: 0,
            dataIndex: currentIndex
        });
    })
}
由于此部分数据一直都在改变,所以toolTip的索引固定即可。
一定要用setTimeout延时一下,不用写延时时间,否则会有部分数据不展示toolTip,有些展示。加个延时就解决了
var column2Draw = {
tooltip: {
trigger: 'axis',
backgroundColor:'rgba(0,0,0,0.8)',
axisPointer: {
type: 'cross'
},
formatter: function (params) {
var relVal = '';
for (var i = 0, l = params.length; i < l; i++) {
relVal += '<span style="font-size:18px; color:#fff;">'+params[i].value[2]+'</span>'+'<br/><span style="display:inline-block;margin-right:5px;border-radius:10px;width:10px;height:10px;background-color:#98FB98"></span> 数量:'+params[i].value[1];
}
return relVal
}
},
dataset: {
source: source2data
},
yAxis: [
{
type: 'category',
axisLine: { //y轴
show: false
},
axisLabel: {
textStyle: { //改变刻度字体样式
color: '#fff',
fontSize: 14
}
},
"axisTick": { //y轴刻度线
"show": false
},
//网格样式
splitLine: {
show: false,
lineStyle: {
color: '#333',
width: 1,
type: 'solid'
}
}
},
],
series: [
{
type: 'bar',
silent: true,
barWidth: 30,
itemStyle: { //上方显示数值
normal: {
color: new echarts.graphic.LinearGradient(1, 0, 0, 0, [{
offset: 0,
color: "#07E07D"
}, // 0% 处的颜色
{
offset: 0.4,
color: "#28AA6E"
}, // 100% 处的颜色
{
offset: 1,
color: "#000"
} // 100% 处的颜色
]),
label: {
show: true, //开启显示
position: 'right', //在上方显示
textStyle: { //数值样式
color: '#fff',
fontSize: 16
},
formatter: function (val) {
// console.log(val);
// ${val.value[0]}:
let html = `
${val.value[1]}
`;
return html;
},
lineHeight: 10,
padding: [5,10,0,-200],
borderRadius: 6,
backgroundColor: '#002262',
}
},
},
},
],
}
多多积累,多多收获!!!
原文地址:https://blog.csdn.net/yehaocheng520/article/details/127287781
本文来自互联网用户投稿,该文观点仅代表作者本人,不代表本站立场。本站仅提供信息存储空间服务,不拥有所有权,不承担相关法律责任。
如若转载,请注明出处:http://www.7code.cn/show_14165.html
如若内容造成侵权/违法违规/事实不符,请联系代码007邮箱:suwngjj01@126.com进行投诉反馈,一经查实,立即删除!
声明:本站所有文章,如无特殊说明或标注,均为本站原创发布。任何个人或组织,在未征得本站同意时,禁止复制、盗用、采集、发布本站内容到任何网站、书籍等各类媒体平台。如若本站内容侵犯了原著者的合法权益,可联系我们进行处理。


