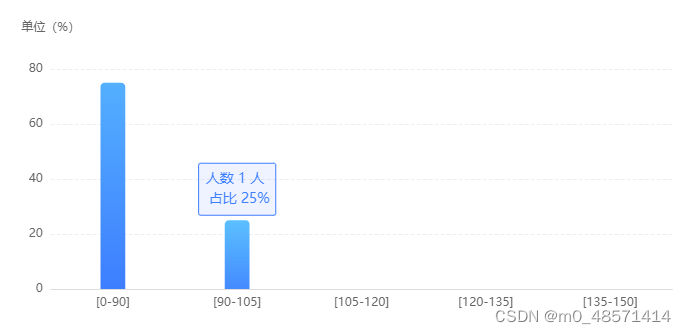
1、y轴为百分比,但是数据不带单位(%)
echarts官网提供的是y轴展示数据和label同步,都是柱条数值,我们只需要将该数值数组做一次转换,再赋值给series的data就可以实现
核心要点:
that.proportion = value.map(item => Math.round(parseFloat(item) / parseFloat(this.sum(value)) * 10000) / 100);let num = Math.round(that.sum(value) * params.data / 100);完整代码如下:
<template>
<div class="garde_section">
<div id="test_chart"></div>
</div>
</template>
<script>
import * as echarts from 'echarts'; // 引入图表组件
export default {
name: 'test',
watch: {
//有图表的地方为了避免刷新之后图表不更新,一般会去监听数据变化,再重新渲染
gardeSectionChartData: {
handler (value) {
this.gardeSection(value);
},
deep: true // 深度监听
}
},
data () {
return {
gardeSectionChart: null,
gardeSectionChartData:{ //图表数据
category = [],
value = []
},
proportion: [],
};
},
mounted () {
this.gardeSection(this.gardeSectionChartData);
},
methods: {
// 图表
gardeSection ({ category = [], value = [] }) {
let that = this;
// 利用每根柱条的值value计算得到柱条比例,Math:round为四舍五入♥♥♥
that.proportion = value.map(item => Math.round(parseFloat(item) / parseFloat(this.sum(value)) * 10000) / 100);
// 基于准备好的dom,初始化echarts实例
that.gardeSectionChart = echarts.init(document.getElementById('test_chart'));
// 绘制图表
that.gardeSectionChart.setOption({
xAxis: [
{
type: 'category',
data: category,
axisTick: { show: false },
axisLabel: {
interval: 0, // 标签全部展示
textStyle: {
color: '#666666'
}
},
axisLine: { lineStyle: { color: '#dddddd' } }
}
],
yAxis: [
{
type: 'value',
name: '单位(%)',
nameGap: 35,
}
],
series: [
{
name: '人数',
type: 'bar',
data: that.proportion,
itemStyle:{
emphasis: {
label: {
show: true,
//label展示的时候再把数值转换回来,不然会展示百分比♥♥♥
formatter: function (params) {
let num = Math.round(that.sum(value) * params.data / 100);
return `人数 ${num} 人 n 占比 ${params.data}%`;
},
//一下为label的一些配置项,设置外边框,背景颜色,字体颜色等
backgroundColor: 'rgba(61,126,255,0.09)',
borderColor: '#3d7eff',
borderWidth: 0.5,
borderRadius: 2,
padding: 6,
position: 'top',
textStyle: {
color: '#3D7EFF',
fontSize: 14,
marginLeft: 0,
lineHeight: 20
}
}
}
}
barWidth: '20%' // 柱条宽度
}
]
}, true); // true:让option不进行合并,而是让旧的数据完全移除,新的option才会创建。
},
sum (arr) { // 数组求和
return eval(arr.join('+'));
}
}
};
</script>
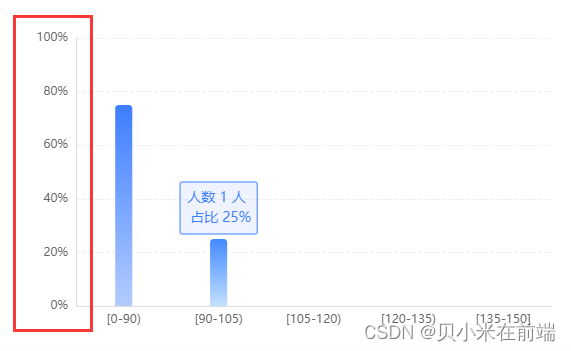
2、y轴为百分比,且数据带有单位(%)
效果图:
yAxis: [
    {
       min:0,   //最小百分比
       max:100, //最大百分比
       type: 'value',
       // name: '单位(%)',
       nameGap: 35,
       nameTextStyle: { color: '#666666' },
       axisTick: { show: false },
       axisLabel: {
            show: true,
            interval: 0, // 使x轴文字显示全
            color: '#666666',
            formatter: '{value}%'  //y轴数值,带百分号
       },
       axisLine: { show: true, lineStyle: { color: '#dddddd' } },
       splitLine: { lineStyle: { type: 'dashed', color: '#eeeeee' } }
     }
],
原文地址:https://blog.csdn.net/m0_48571414/article/details/126303149
本文来自互联网用户投稿,该文观点仅代表作者本人,不代表本站立场。本站仅提供信息存储空间服务,不拥有所有权,不承担相关法律责任。
如若转载,请注明出处:http://www.7code.cn/show_21814.html
如若内容造成侵权/违法违规/事实不符,请联系代码007邮箱:suwngjj01@126.com进行投诉反馈,一经查实,立即删除!
声明:本站所有文章,如无特殊说明或标注,均为本站原创发布。任何个人或组织,在未征得本站同意时,禁止复制、盗用、采集、发布本站内容到任何网站、书籍等各类媒体平台。如若本站内容侵犯了原著者的合法权益,可联系我们进行处理。


