本文介绍: 文章目录四、实例4.1 px的折线图4.1.1 加拿大的预期寿命4.1.2 带有列编码颜色的折线图4.1.3 Dash中的折线图4.1.4 折线图中的数据顺序4.1.5 连通散点图4.1.6 带标记的折线图4.1.7 symbol参数可用于将数据字段映射到标记符号4.1.8 日期轴上的折线图4.1.9 Sparklines with Plotly Express4.2 go.Scatter的折线图4.2.1 简单折线图4.2.2 折线图模式4.2.3 样式折线图4.2.4 连接数据缺口4.2.5 折线图插值
四、实例
4.1 px的折线图
4.1.1 加拿大的预期寿命
import plotly.express as px

df = px.data.gapminder().query("country=='Canada'")
fig = px.line(df, x="year", y="lifeExp", title='加拿大的预期寿命')
fig.show()

4.1.2 带有列编码颜色的折线图
import plotly.express as px

df = px.data.gapminder().query("continent=='Oceania'")
fig = px.line(df, x="year", y="lifeExp", color='country')
fig.show()

4.1.3 Dash中的折线图
import dash
from dash import html, dcc
from dash.dependencies import Input, Output
import plotly.express as px

df = px.data.gapminder()
all_continents = df.continent.unique()

app = dash.Dash(__name__)

app.layout = html.Div([
    dcc.Checklist(
        id="checklist",
        options=[{"label": x, "value": x}
                 for x in all_continents],
        value=all_continents[3:],
        labelStyle={'display': 'inline-block'}
    ),
    dcc.Graph(id="line-chart"),
])

@app.callback(
    Output("line-chart", "figure"),
    [Input("checklist", "value")])
def update_line_chart(continents):
    mask = df.continent.isin(continents)
    fig = px.line(df[mask],
        x="year", y="lifeExp", color='country')
    return fig

app.run_server(debug=True)

4.1.4 折线图中的数据顺序
import plotly.express as px
import pandas as pd

df = pd.DataFrame(dict(
    x = [1, 3, 2, 4],
    y = [1, 2, 3, 4]
))
fig = px.line(df, x="x", y="y", title="Unsorted Input")
fig.show()

df = df.sort_values(by="x")
fig = px.line(df, x="x", y="y", title="Sorted Input")
fig.show()


4.1.5 连通散点图
import plotly.express as px

df = px.data.gapminder().query("country in ['Canada', 'Botswana']")

fig = px.line(df, x="lifeExp", y="gdpPercap", color="country", text="year")
fig.update_traces(textposition="bottom right")
fig.show()

4.1.6 带标记的折线图
import plotly.express as px
df = px.data.gapminder().query("continent == 'Oceania'")
fig = px.line(df, x='year', y='lifeExp', color='country', markers=True)
fig.show()

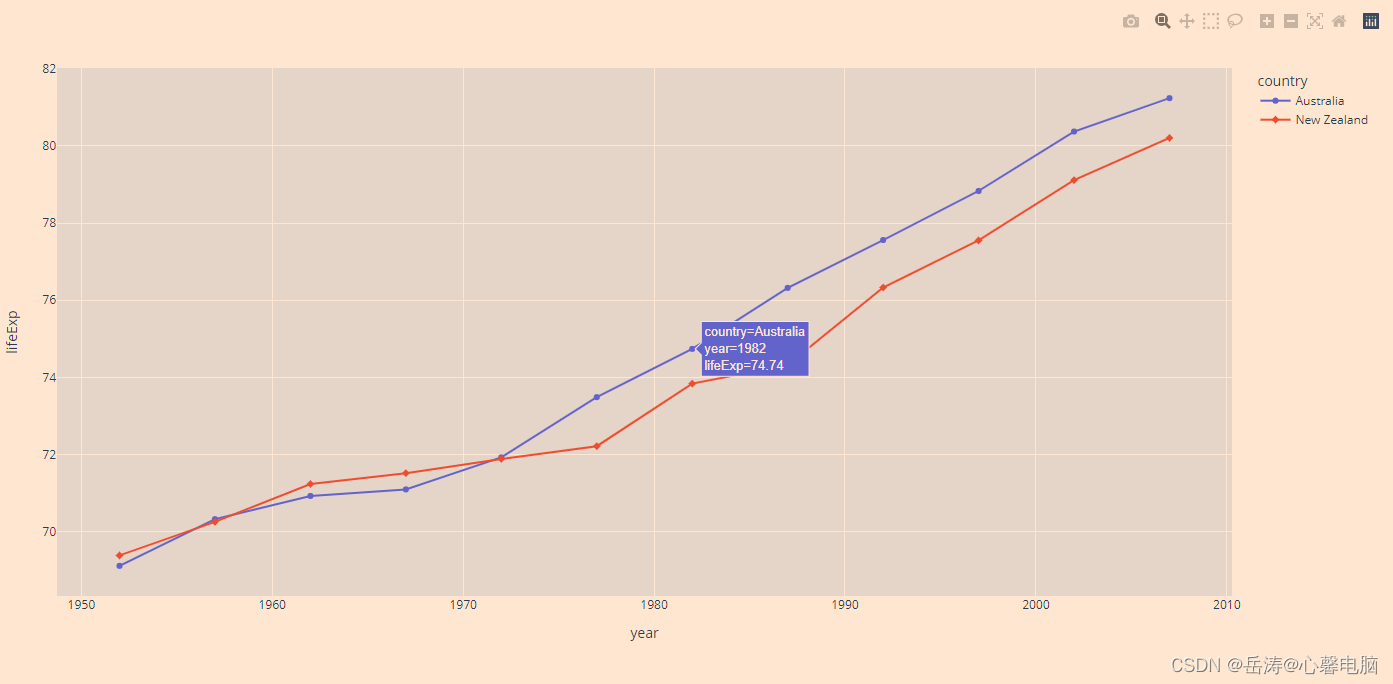
4.1.7 symbol参数可用于将数据字段映射到标记符号
import plotly.express as px
df = px.data.gapminder().query("continent == 'Oceania'")
fig = px.line(df, x='year', y='lifeExp', color='country', symbol="country")
fig.show()
4.1.8 日期轴上的折线图
- 线图可以使用任何类型的笛卡尔坐标轴绘制,包括线性、对数、分类或日期轴。日期轴上的直线图通常称为时间序列图。
- 当相应的数据是ISO格式的日期字符串,或者是日期列或日期时间NumPy数组时,Plotly自动将轴类型设置为日期格式。
import plotly.express as px

df = px.data.stocks()
fig = px.line(df, x='date', y="GOOG")
fig.show()

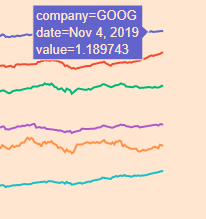
4.1.9 Sparklines with Plotly Express
Sparklines是子图内的散点图,删除了网格线、轴线和记号。
import plotly.express as px
df = px.data.stocks(indexed=True)
fig = px.line(df, facet_row="company", facet_row_spacing=0.01, height=200, width=200)

# 隐藏并锁定轴
fig.update_xaxes(visible=False, fixedrange=True)
fig.update_yaxes(visible=False, fixedrange=True)

# 删除标签
fig.update_layout(annotations=[], overwrite=True)

# 把其余部分删掉
fig.update_layout(
    showlegend=False,
    plot_bgcolor="white",
    margin=dict(t=10,l=10,b=10,r=10)
)

# 对于这样小的绘图,禁用模式栏
fig.show(config=dict(displayModeBar=False))
4.2 go.Scatter的折线图
4.2.1 简单折线图
import plotly.graph_objects as go
import numpy as np

x = np.arange(10)

fig = go.Figure(data=go.Scatter(x=x, y=x**2))
fig.show()

4.2.2 折线图模式
import plotly.graph_objects as go

# Create random data with numpy
import numpy as np
np.random.seed(1)

N = 100
random_x = np.linspace(0, 1, N)
random_y0 = np.random.randn(N) + 5
random_y1 = np.random.randn(N)
random_y2 = np.random.randn(N) - 5

# 创建轨迹
fig = go.Figure()
fig.add_trace(go.Scatter(x=random_x, y=random_y0,
                    mode='lines',
                    name='lines'))
fig.add_trace(go.Scatter(x=random_x, y=random_y1,
                    mode='lines+markers',
                    name='lines+markers'))
fig.add_trace(go.Scatter(x=random_x, y=random_y2,
                    mode='markers', name='markers'))

fig.show()

4.2.3 样式折线图
此示例设置轨迹的颜色和虚线样式,添加轨迹名称,修改线宽,以及添加打印和轴标题。
import plotly.graph_objects as go

# 添加数据
month = ['January', 'February', 'March', 'April', 'May', 'June', 'July',
         'August', 'September', 'October', 'November', 'December']
high_2000 = [32.5, 37.6, 49.9, 53.0, 69.1, 75.4, 76.5, 76.6, 70.7, 60.6, 45.1, 29.3]
low_2000 = [13.8, 22.3, 32.5, 37.2, 49.9, 56.1, 57.7, 58.3, 51.2, 42.8, 31.6, 15.9]
high_2007 = [36.5, 26.6, 43.6, 52.3, 71.5, 81.4, 80.5, 82.2, 76.0, 67.3, 46.1, 35.0]
low_2007 = [23.6, 14.0, 27.0, 36.8, 47.6, 57.7, 58.9, 61.2, 53.3, 48.5, 31.0, 23.6]
high_2014 = [28.8, 28.5, 37.0, 56.8, 69.7, 79.7, 78.5, 77.8, 74.1, 62.6, 45.3, 39.9]
low_2014 = [12.7, 14.3, 18.6, 35.5, 49.9, 58.0, 60.0, 58.6, 51.7, 45.2, 32.2, 29.1]

fig = go.Figure()
# 创建轨迹并添加样式
fig.add_trace(go.Scatter(x=month, y=high_2014, name='High 2014',
                         line=dict(color='firebrick', width=4)))
fig.add_trace(go.Scatter(x=month, y=low_2014, name = 'Low 2014',
                         line=dict(color='royalblue', width=4)))
fig.add_trace(go.Scatter(x=month, y=high_2007, name='High 2007',
                         line=dict(color='firebrick', width=4,
                              dash='dash') # dash options include 'dash', 'dot', and 'dashdot'
))
fig.add_trace(go.Scatter(x=month, y=low_2007, name='Low 2007',
                         line = dict(color='royalblue', width=4, dash='dash')))
fig.add_trace(go.Scatter(x=month, y=high_2000, name='High 2000',
                         line = dict(color='firebrick', width=4, dash='dot')))
fig.add_trace(go.Scatter(x=month, y=low_2000, name='Low 2000',
                         line=dict(color='royalblue', width=4, dash='dot')))

# 编辑布局
fig.update_layout(title='纽约的平均高温和低温',
                   xaxis_title='月份',
                   yaxis_title='温度 (华氏度)')


fig.show()

4.2.4 连接数据缺口
import plotly.graph_objects as go

x = [1, 2, 3, 4, 5, 6, 7, 8, 9, 10, 11, 12, 13, 14, 15]

fig = go.Figure()

fig.add_trace(go.Scatter(
    x=x,
    y=[10, 20, None, 15, 10, 5, 15, None, 20, 10, 10, 15, 25, 20, 10],
    name = '<b>No</b> Gaps', # 带有html标记的样式名称/图例条目
    connectgaps=True # 覆盖默认值以连接间隙
))
fig.add_trace(go.Scatter(
    x=x,
    y=[5, 15, None, 10, 5, 0, 10, None, 15, 5, 5, 10, 20, 15, 5],
    name='Gaps',
))

fig.show()

4.2.5 折线图插值
import plotly.graph_objects as go
import numpy as np

x = np.array([1, 2, 3, 4, 5])
y = np.array([1, 3, 2, 3, 1])

fig = go.Figure()
fig.add_trace(go.Scatter(x=x, y=y, name="linear",
                    line_shape='linear'))
fig.add_trace(go.Scatter(x=x, y=y + 5, name="spline",
                    text=["调整线条平滑度<br>在直线对象中使用'smoothing'"],
                    hoverinfo='text+name',
                    line_shape='spline'))
fig.add_trace(go.Scatter(x=x, y=y + 10, name="vhv",
                    line_shape='vhv'))
fig.add_trace(go.Scatter(x=x, y=y + 15, name="hvh",
                    line_shape='hvh'))
fig.add_trace(go.Scatter(x=x, y=y + 20, name="vh",
                    line_shape='vh'))
fig.add_trace(go.Scatter(x=x, y=y + 25, name="hv",
                    line_shape='hv'))

fig.update_traces(hoverinfo='text+name', mode='lines+markers')
fig.update_layout(legend=dict(y=0.5, traceorder='reversed', font_size=16))

fig.show()

4.2.6 带注释的标签线
import plotly.graph_objects as go
import numpy as np

title = '主要新闻来源'
labels = ['电视', '报纸', '网络', '收音机']
colors = ['rgb(67,67,67)', 'rgb(115,115,115)', 'rgb(49,130,189)', 'rgb(189,189,189)']

mode_size = [8, 8, 12, 8]
line_size = [2, 2, 4, 2]

x_data = np.vstack((np.arange(2001, 2014),)*4)

y_data = np.array([
    [74, 82, 80, 74, 73, 72, 74, 70, 70, 66, 66, 69],
    [45, 42, 50, 46, 36, 36, 34, 35, 32, 31, 31, 28],
    [13, 14, 20, 24, 20, 24, 24, 40, 35, 41, 43, 50],
    [18, 21, 18, 21, 16, 14, 13, 18, 17, 16, 19, 23],
])

fig = go.Figure()

for i in range(0, 4):
    fig.add_trace(go.Scatter(x=x_data[i], y=y_data[i], mode='lines',
        name=labels[i],
        line=dict(color=colors[i], width=line_size[i]),
        connectgaps=True,
    ))

    # endpoints
    fig.add_trace(go.Scatter(
        x=[x_data[i][0], x_data[i][-1]],
        y=[y_data[i][0], y_data[i][-1]],
        mode='markers',
        marker=dict(color=colors[i], size=mode_size[i])
    ))

fig.update_layout(
    xaxis=dict(
        showline=True,
        showgrid=False,
        showticklabels=True,
        linecolor='rgb(204, 204, 204)',
        linewidth=2,
        ticks='outside',
        tickfont=dict(
            family='Arial',
            size=12,
            color='rgb(82, 82, 82)',
        ),
    ),
    yaxis=dict(
        showgrid=False,
        zeroline=False,
        showline=False,
        showticklabels=False,
    ),
    autosize=False,
    margin=dict(
        autoexpand=False,
        l=100,
        r=20,
        t=110,
    ),
    showlegend=False,
    plot_bgcolor='white'
)

annotations = []

# 添加标签
for y_trace, label, color in zip(y_data, labels, colors):
    # 标记绘图的左侧
    annotations.append(dict(xref='paper', x=0.05, y=y_trace[0],
                                  xanchor='right', yanchor='middle',
                                  text=label + ' {}%'.format(y_trace[0]),
                                  font=dict(family='Arial',
                                            size=16),
                                  showarrow=False))
    # 标记绘图的右侧
    annotations.append(dict(xref='paper', x=0.95, y=y_trace[11],
                                  xanchor='left', yanchor='middle',
                                  text='{}%'.format(y_trace[11]),
                                  font=dict(family='Arial',
                                            size=16),
                                  showarrow=False))
# 标题
annotations.append(dict(xref='paper', yref='paper', x=0.0, y=1.05,
                              xanchor='left', yanchor='bottom',
                              text='主要新闻来源',
                              font=dict(family='Arial',
                                        size=30,
                                        color='rgb(37,37,37)'),
                              showarrow=False))
# Source
annotations.append(dict(xref='paper', yref='paper', x=0.5, y=-0.1,
                              xanchor='center', yanchor='top',
                              text='来源: PewResearch Center & ' +
                                   'Storytelling with data',
                              font=dict(family='Arial',
                                        size=12,
                                        color='rgb(150,150,150)'),
                              showarrow=False))

fig.update_layout(annotations=annotations)

fig.show()

4.2.7 填充折线图
import plotly.graph_objects as go
import numpy as np


x = [1, 2, 3, 4, 5, 6, 7, 8, 9, 10]
x_rev = x[::-1]

# Line 1
y1 = [1, 2, 3, 4, 5, 6, 7, 8, 9, 10]
y1_upper = [2, 3, 4, 5, 6, 7, 8, 9, 10, 11]
y1_lower = [0, 1, 2, 3, 4, 5, 6, 7, 8, 9]
y1_lower = y1_lower[::-1]

# Line 2
y2 = [5, 2.5, 5, 7.5, 5, 2.5, 7.5, 4.5, 5.5, 5]
y2_upper = [5.5, 3, 5.5, 8, 6, 3, 8, 5, 6, 5.5]
y2_lower = [4.5, 2, 4.4, 7, 4, 2, 7, 4, 5, 4.75]
y2_lower = y2_lower[::-1]

# Line 3
y3 = [10, 8, 6, 4, 2, 0, 2, 4, 2, 0]
y3_upper = [11, 9, 7, 5, 3, 1, 3, 5, 3, 1]
y3_lower = [9, 7, 5, 3, 1, -.5, 1, 3, 1, -1]
y3_lower = y3_lower[::-1]


fig = go.Figure()

fig.add_trace(go.Scatter(
    x=x+x_rev,
    y=y1_upper+y1_lower,
    fill='toself',
    fillcolor='rgba(0,100,80,0.2)',
    line_color='rgba(255,255,255,0)',
    showlegend=False,
    name='合理的',
))
fig.add_trace(go.Scatter(
    x=x+x_rev,
    y=y2_upper+y2_lower,
    fill='toself',
    fillcolor='rgba(0,176,246,0.2)',
    line_color='rgba(255,255,255,0)',
    name='优质的',
    showlegend=False,
))
fig.add_trace(go.Scatter(
    x=x+x_rev,
    y=y3_upper+y3_lower,
    fill='toself',
    fillcolor='rgba(231,107,243,0.2)',
    line_color='rgba(255,255,255,0)',
    showlegend=False,
    name='理想的',
))
fig.add_trace(go.Scatter(
    x=x, y=y1,
    line_color='rgb(0,100,80)',
    name='合理的',
))
fig.add_trace(go.Scatter(
    x=x, y=y2,
    line_color='rgb(0,176,246)',
    name='优质的',
))
fig.add_trace(go.Scatter(
    x=x, y=y3,
    line_color='rgb(231,107,243)',
    name='理想的',
))

fig.update_traces(mode='lines')
fig.show()

4.2.8 Dash中的go折线图
- Dash是一个用于构建分析应用程序的开源框架,不需要Javascript,它与Plotly graphing库紧密集成。
- 在这个页面的任何地方,你都可以看到fig.show(),你可以通过把它从内置的Dash_core_components包传递到Graph组件的figure参数,在Dash应用程序中显示相同的图形,如下所示:
import plotly.graph_objects as go

import dash
from dash import html, dcc

import numpy as np
np.random.seed(1)

N = 100
random_x = np.linspace(0, 1, N)
random_y0 = np.random.randn(N) + 5
random_y1 = np.random.randn(N)
random_y2 = np.random.randn(N) - 5

fig = go.Figure()
fig.add_trace(go.Scatter(x=random_x, y=random_y0,
                    mode='lines',
                    name='lines'))
fig.add_trace(go.Scatter(x=random_x, y=random_y1,
                    mode='lines+markers',
                    name='lines+markers'))
fig.add_trace(go.Scatter(x=random_x, y=random_y2,
                    mode='markers', name='markers'))

app = dash.Dash()
app.layout = html.Div([
    dcc.Graph(figure=fig)
])

app.run_server(debug=True, use_reloader=False, port=8051)

原文地址:https://blog.csdn.net/yuetaope/article/details/123082835
本文来自互联网用户投稿,该文观点仅代表作者本人,不代表本站立场。本站仅提供信息存储空间服务,不拥有所有权,不承担相关法律责任。
如若转载,请注明出处:http://www.7code.cn/show_28370.html
如若内容造成侵权/违法违规/事实不符,请联系代码007邮箱:suwngjj01@126.com进行投诉反馈,一经查实,立即删除!
声明:本站所有文章,如无特殊说明或标注,均为本站原创发布。任何个人或组织,在未征得本站同意时,禁止复制、盗用、采集、发布本站内容到任何网站、书籍等各类媒体平台。如若本站内容侵犯了原著者的合法权益,可联系我们进行处理。

