前言
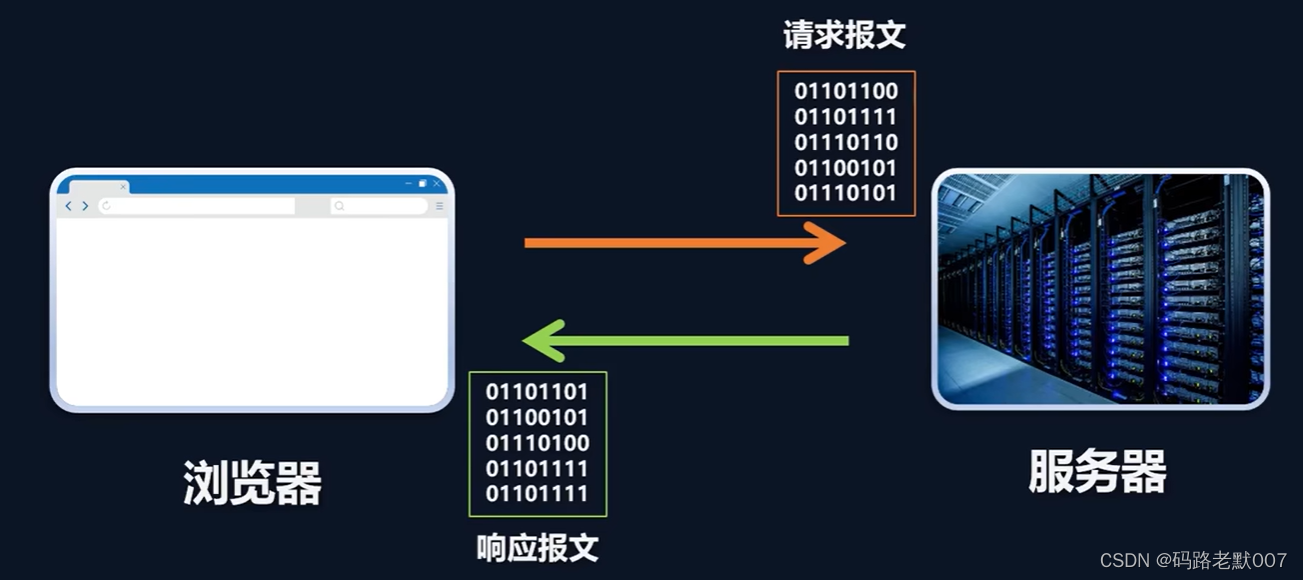
功能:根据课设要求,当协调器收到信息时,我要解析收到的数据,动态显示出拓扑图,当点击拓扑图节点时,显示该节点的地址以及采集的湿度和温度
技术栈:node.js解决串口通信问题,串口收到的数据通过express框架上传到服务器,前端通过axios请求服务器拿取数据,前端拿到数据后通过echarts渲染拓扑图,前后端通信存在跨域问题,利用代理转发解决
所遇困难:
1. 接收串口数据断断续续,零零散散(后端获取串口数据)
2.访问数据存在跨域问题(前端获取后端数据)
3.echarts拓扑图配置项陌生(数据可视化)
4.下行数据时,需要从前端向后端传输用户指令,不方便利用Post,这里使用Get查询字符串传参
5.下行数据,无法像串口助手一样按十六进制给协调器发指令,这里要对数据进行一个特殊处理
一、node.js中的serialport模块
serialport是解决串口通信的,可以收到串口传来的数据,也可以实现下行,先来说说如何安装
npm install serialport@10.4.0
这里注意一点,serialport这个包版本很多,每个版本的使用方法都不一样,这里给出本文使用的版本号
“serialport“: “^10.4.0”
安装好后,现在就可以开始使用了,给出使用的代码
// 引入串口通信的模块
const { SerialPort } = require('serialport');

//打开COM5串口 串口号 波特率 这些都是设置好的 可以查看
const serialport = new SerialPort({ path: 'COM5', baudRate: 115200,
    dataBits: 8, }, (err) => {
    if (err) {
        console.log('端口打开失败!');
        return;
    }
    console.log('端口打开成功!',serialport.isOpen);
});

// 监听串口 只要串口有数据发送过来 都会执行回调函数
serialport.on('data',(data) => {
     //接收串口传递来的数据
    console.log(data.toString());
})


//错误监听
serialport.on('error',function (error) {
    console.log('error: '+error)
})

//写入  实现下行数据
 serialport.write('')
写到这就已经可以监听串口了,这里讲一个本人遇到的一个棘手的问题,相信大家都会碰到
就是串口传递过来的数据,会被一段一段的切分开,这样就会很难处理数据,例如: 原数据为01 3D 47 00 00 12 A4 32 33
可能我第一次接收到的就为 01 3 剩下的D 47 00 00 12 A4 32 33 会被遗留到第二次发送,这样数据就会很乱,很难处理
这里给出解决思路:可以定义一个全局数组,把每次来的数据全部压入这个数组中,然后把数组拼接,按照原始数据长度进行切割,切割出来的数据赋值给一个变量,剩下的数据接着放置在数组中,每次来的数据都压入数组内,继续切割,继续压入…循环操作
拿到数据以后进行切割,比如01 3D 47 00 00 12 A4 32 33,01代表类型,47 3D 代表路由器地址,00 00代表协调器地址, A4 12代表终端地址,32、33分别代表终端采集到的温度和湿度,所以01这条数据类型就代表,温湿度数据通过终端发送给了路由器,路由器转发给协调器
我要对数据进行切割,然后给不同的变量赋值,将这些变量通过express框架发送给前端
二、express框架
//导入express
const express = require('express');

//创建express实例对象
const app = express()

//编写接口
app.get('/zigbee/upo', (req, res) => {
     res.send({
        'nodes' :  [router,terminal1] ,
        'lines' : lines1
    })}
    )

//启动服务
app.listen('8888', () => {
    console.log('服务器启动成功!');
})
写到这后端的事情基本上就做完了,剩下的就是前端来渲染数据,难点是拓扑图,拓扑图是参考csdn上一位大佬的
三、echarts实现拓扑图
这里贴出app.main中所有的代码,包括axios请求数据,渲染拓扑图,给拓扑图注册点击事件
版本号: “echarts”: “^5.4.2”,
<template>
<div align="center" class="echart-block">
<el-row style="padding: 0 1000px 0 1000px">
<el-button @click="update1" size="medium" type="primary" round
>终端1-路由-协调器</el-button
>
<el-button @click="update2" type="success" round>终端2-协调器</el-button>
</el-row>
<div style="height: 100%" ref="graphchart"></div>
<el-input
type="textarea"
class="talk-textarea"
v-model="message"
@keyup.enter.native="enterFun"
>
</el-input>
</div>
</template>
<script>
import * as echarts from 'echarts'
import axios from 'axios'
export default {
data () {
return {
message: '',
res: '',
option: {},
echart: null,
nodes: [
// symbol 默认为圆形 diamond 菱形 triangle 三角形
{
name: '协调器',
value: [0, 0],
symbol: 'circle'
}
],
lines: []
}
},
components: {},
mounted () {
this.drawChart()
},
methods: {
async enterFun () {
await axios.get(`http://localhost:8081/zigbee/message?message=${this.message}`)
},
async update1 () {
const res = await axios.get('http://localhost:8081/zigbee/upo')
console.log(res)
if (res.data.lines.length === 0) {
return
}
for (let i = 0; i < 2; i++) {
this.nodes.push(res.data.nodes[i])
}
for (let i = 0; i < 4; i++) {
this.lines.push(res.data.lines[i])
}
this.echart.clear()
this.echart.setOption(this.option)
console.log(res.data)
},
async update2 () {
const res2 = await axios.get('http://localhost:8081/zigbee/upt')
if (res2.data.lines.length === 0) {
return
}
this.nodes.push(res2.data.nodes[0])
for (let i = 0; i < 2; i++) {
this.lines.push(res2.data.lines[i])
}
this.echart.clear()
this.echart.setOption(this.option)
console.log(res2.data)
},
drawChart () {
this.echart = echarts.init(this.$refs.graphchart)
this.option = {
tooltip: { trigger: '1' },
legend: {
textStyle: { fontSize: 20 },
top: '5%',
bottom: '30%',
left: 'center',
itemWidth: 20,
itemHeight: 20,
data: [
{ icon: 'circle', name: '协调器' },
{ icon: 'diamond', name: '终端' },
{ icon: 'triangle', name: '路由器' }
]
},
title: {
text: '无线传感网拓扑图',
textStyle: {
fontSize: 70
}
},
polar: {},
// 极坐标系的径向轴
radiusAxis: {
show: false
},
// 极坐标系的角度轴
angleAxis: {
type: 'value',
min: 0,
max: 360,
show: false
},
series: [
{
name: '终端',
type: 'graph',
coordinateSystem: 'polar',
label: {
show: true,
position: 'inside',
fontSize: 14
},
// layout:'circular',
symbol: 'circle',
symbolSize: 50,
symbolPosition: 'start',
nodes: this.nodes
// links: this.links
},
{
name: '路由器',
type: 'lines',
coordinateSystem: 'polar',
zlevel: 1,
symbol: ['none', 'arrow'],
symbolSize: 10,
polyline: true,
effect: {
show: true,
period: 4,
smooth: true,
trailLength: 0.2,
symbol: 'arrow',
// symbol: 'circle',
color: 'rgba(55,155,255,0.5)',
symbolSize: 20,
loop: true
},
lineStyle: {
normal: {
color: '#1DE9B6',
width: 3, // 线条宽度
opacity: 0.6, // 尾迹线条透明度
curveness: 0.3 // 尾迹线条曲直度
}
},
data: this.lines
},
{
name: '协调器',
type: 'graph',
coordinateSystem: 'polar',
label: {
show: true,
position: 'inside',
fontSize: 14
}, // layout:'circular', symbol: 'circle',
symbolSize: 50,
symbolPosition: 'start'
}
]
}
this.echart.setOption(this.option)
this.echart.on('click', async function (params) {
console.log('myChart----click---:', params.name)
const res = await axios.get('http://localhost:8081/zigbee/data')
console.log(res.data)
switch (params.name) {
case '路由器':
alert('路由器地址为' + res.data.address3)
break
case '终端1':
alert(
'终端2地址为' +
res.data.address1 +
'n' +
'温度为' +
res.data.tem1 +
'n' +
'湿度为' +
res.data.humidity1 +
'n' +
'历史温度为' +
res.data.tem1 +
'n' +
'历史湿度为' +
res.data.humidity1
)
break
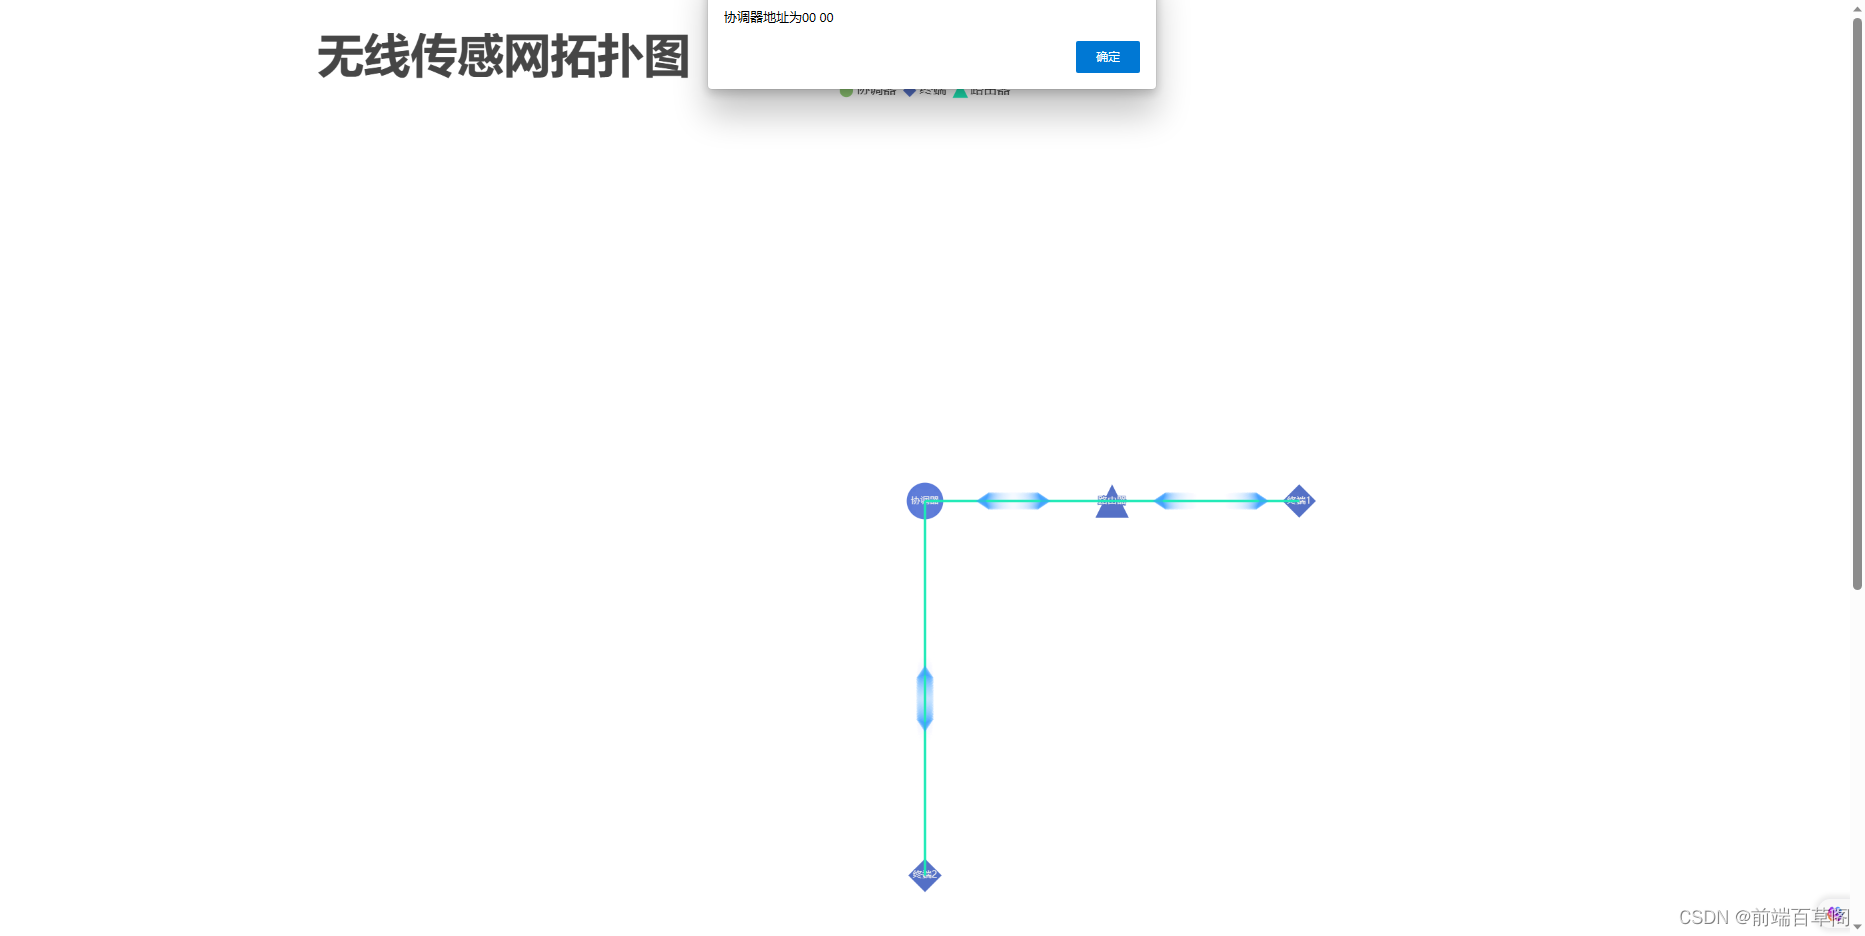
case '协调器':
alert('协调器地址为' + '00 00')
break
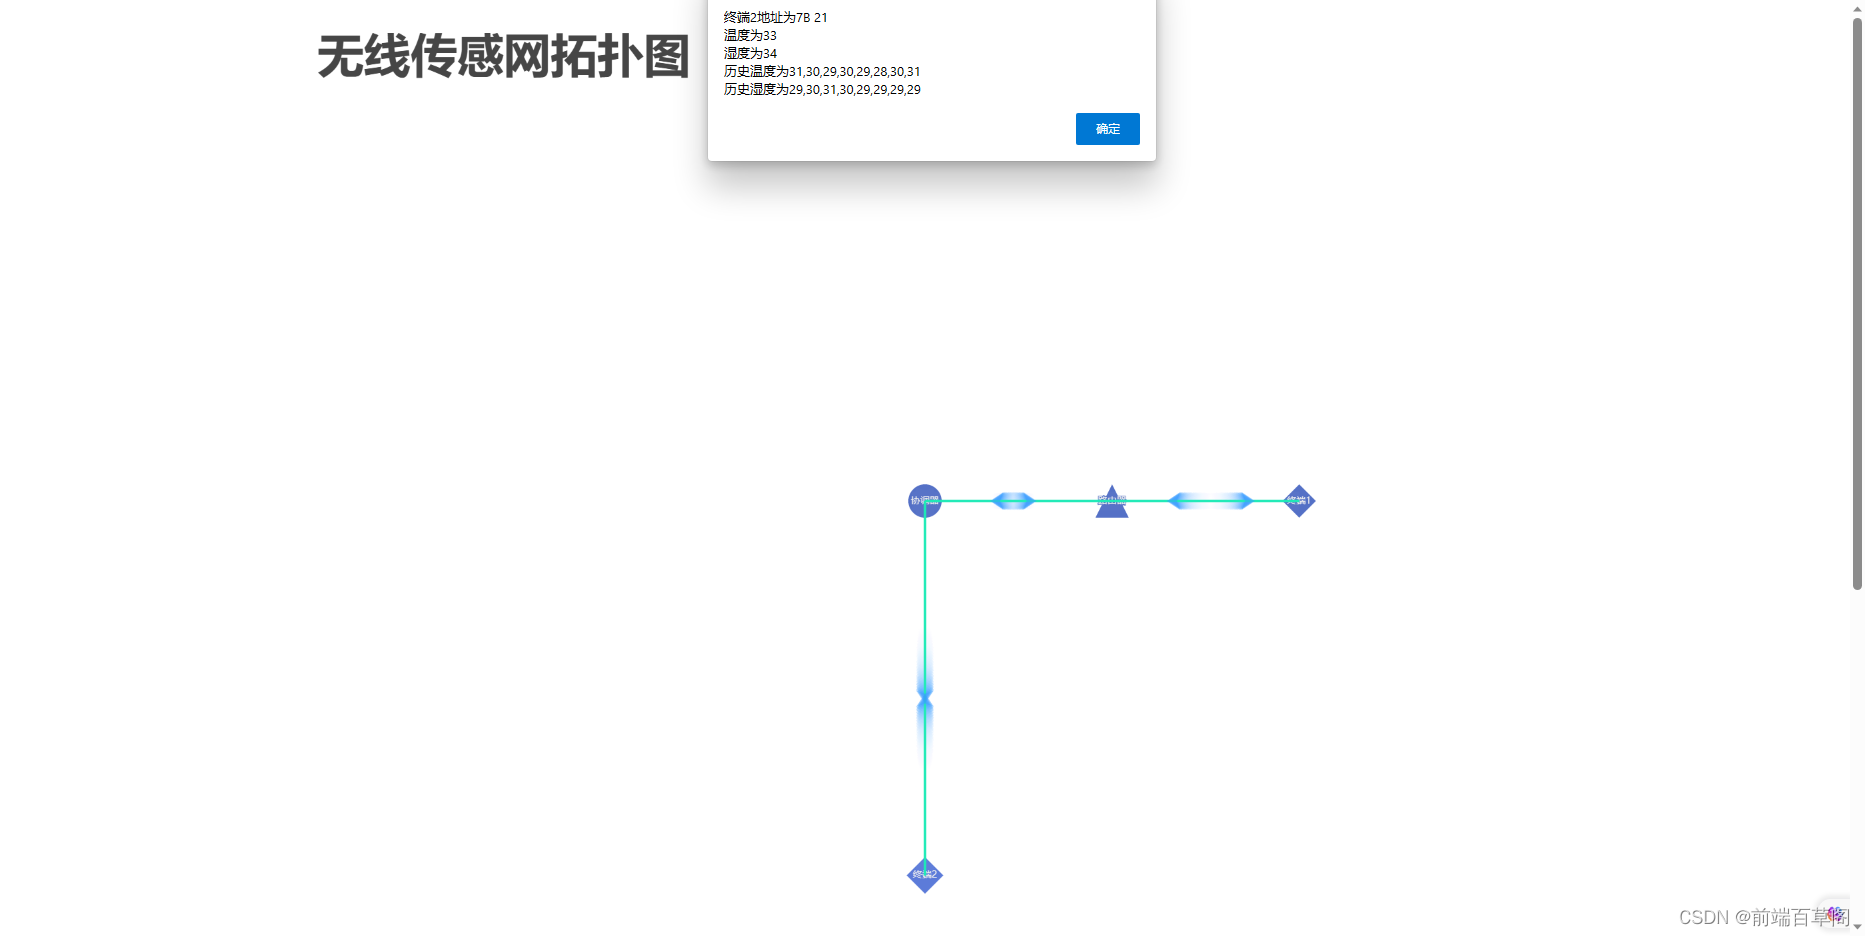
case '终端2':
alert(
'终端2地址为' +
res.data.address2 +
'n' +
'温度为' +
res.data.tem2 +
'n' +
'湿度为' +
res.data.humidity2 +
'n' +
'历史温度为' +
res.data.historyT2 +
'n' +
'历史湿度为' +
res.data.historyH2
)
break
}
})
}
}
}
</script>
<style scoped>
.echart-block {
height: 150vh;
}
</style>
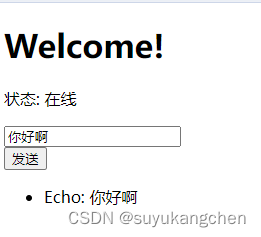
四、实现下行数据
实现思路: 当用户在输入框内按下回车,则把用户输入的数据传递给后端,让后端发送数据给协调器,说着简单,但是难点在于数据的格式,要如何像串口调试助手一样以十六进制发送给协调器呢?
//前端发送数据给后端  由于express框架 不方便利用post方式传值,所以这里利用查询字符串的方式传递参数
async enterFun () {
      await axios.get(`http://localhost:8081/zigbee/message?message=${this.message}`)
    }
// 后端接收数据 并且处理数据 数据处理好后 通过write方法 发送给协调器
app.get('/zigbee/message', (req, res) => {
	//  拿get方式传递过来的参数
    let str = req.query.message
    strs = str.split(" ");//将一个十六进制报文转为字符数组
	for(let i = 0;i<strs.length;i++){

	  strs[i] = "0x"+strs[i];

	}//每个字符加上0x

	let buffer = Buffer.from(strs);//将数组放到buffer
		// 发送数据给协调器
	    serialport.write(buffer)
})
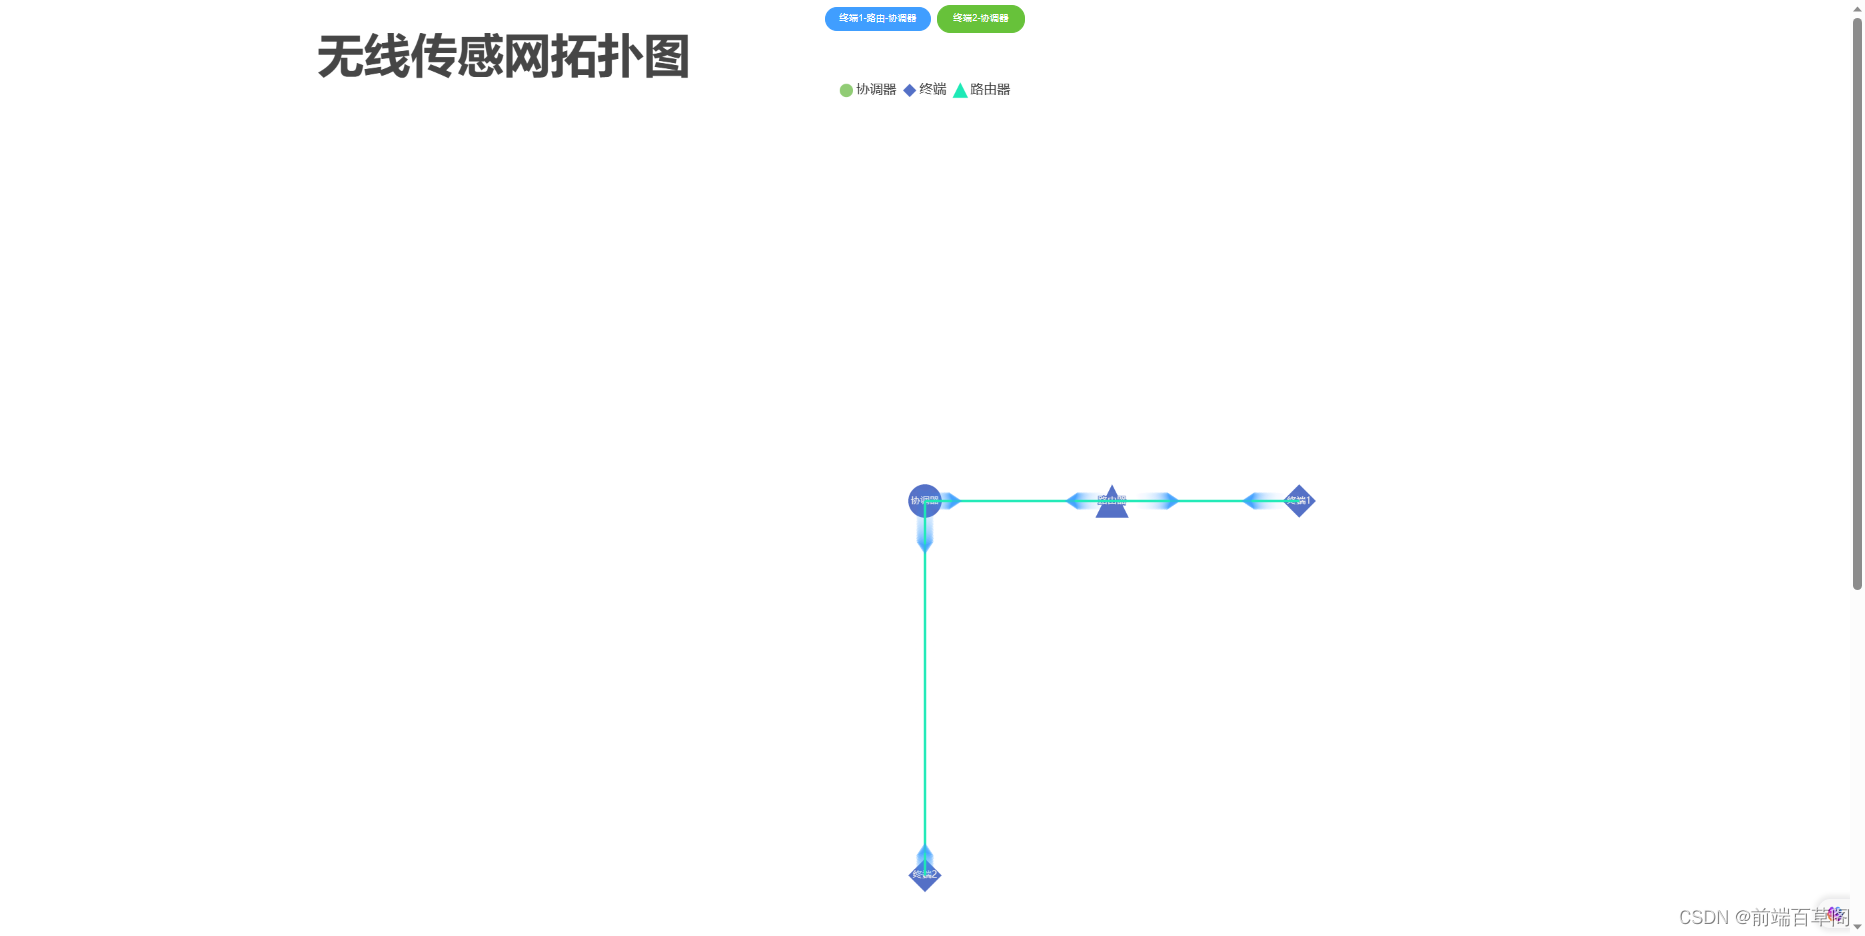
五、成果展示
当有设备加入无线传感网时,更新拓扑图
用户点击拓扑图节点时,显示相关数据
总结
本课设我负责的部分是利用前后端实现上位机,实现思路和逻辑都已交代完全
由于本文设计各类知识点,笔者将自己遇到的困难都写在这儿了,若有疑问,欢迎私信沟通!
原文地址:https://blog.csdn.net/m0_57524265/article/details/131478575
本文来自互联网用户投稿,该文观点仅代表作者本人,不代表本站立场。本站仅提供信息存储空间服务,不拥有所有权,不承担相关法律责任。
如若转载,请注明出处:http://www.7code.cn/show_11463.html
如若内容造成侵权/违法违规/事实不符,请联系代码007邮箱:suwngjj01@126.com进行投诉反馈,一经查实,立即删除!