import numpy as np
import pandas as pd
- 为了方便维护,数据在数据库内都是分表存储的,比如用一个表存储所有用户的基本信息,一个表存储用户的消费情况。
- 所以,在日常的数据处理中,经常需要将两张表拼接起来使用,这样的操作对应到 SQL 中是 join,在 Pandas 中则是用 merge 来实现。这篇文章就讲一下 merge 的主要原理。
- 上面的引入部分说到 merge 是用来拼接两张表的,那么拼接时自然就需要将用户信息一一对应地进行拼接,所以进行拼接的两张表需要有一个共同的识别用户的键(key)。
- 总结来说,整个 merge 的过程就是将信息一一对应匹配的过程,下面介绍 merge 的四种类型,分别为 inner、left、right 和 outer。
一、merge() 函数
pd.merge(left,right,how: str = 'inner',on=None,left_on=None,right_on=None,left_index: bool = False,
right_index: bool = False,sort: bool = False,suffixes=('_x', '_y'),copy: bool = True,indicator: bool = False,validate=None,)
- merge() 函数的参数含义如下:
- left/right 表示两个不同的 DataFrame 对象。
- how 表示要执行的合并类型,从 {‘left’, ‘right’, ‘outer’, ‘inner’} 中取值,默认为 inner 内连接。
- on 表示指定用于连接的键(即列标签的名字),该键必须同时存在于左右两个 DataFrame 中,如果没有指定,并且其他参数也未指定,那么将会以两个 DataFrame 的列名交集做为连接键。
- left_on 表示指定左侧 DataFrame 中作连接键的列名。该参数在左、右列标签名不相同,但表达的含义相同时非常有用。
- right_on 表示指定左侧 DataFrame 中作连接键的列名。
- left_index 为布尔参数,默认为 False。如果为 True 则使用左侧 DataFrame 的行索引作为连接键。
- right_index 为布尔参数,默认为 False。如果为 True 则使用左侧 DataFrame 的行索引作为连接键。
- sort 为布尔参数,默认为 False,则按照 how 给定的参数值进行排序。设置为 True,它会将合并后的数据进行排序。
- suffixes 表示字符串组成的元组。当左右 DataFrame 存在相同列名时,通过该参数可以在相同的列名后附加后缀名,默认为 (‘x’,‘y’)。
- copy 默认为 True,表示对数据进行复制。
- 这里需要注意的是,Pandas 库的 merge() 支持各种内外连接,与其相似的还有 join() 函数(默认为左连接)。
1. inner

df_1 = pd.DataFrame({
                     "userid":['a', 'b', 'c', 'd'],
                     "age":[23, 46, 32, 19]
                    })
df_1
#  userid age
#0	a	  23
#1	b	  46
#2	c	  32
#3	d	  19
df_2 = pd.DataFrame({
        "userid":['a', 'c'],
        "payment":[2000, 3500]
    })
df_2
#userid	payment
#0	a	2000
#1	c	3500
df_1.merge(df_2,on='userid')
#userid	age	payment
#0	a	23	2000
#1	c	32	3500
- 还有另一种写法。
pd.merge(df_1, df_2, on='userid')
#userid	age	payment
#0	a	23	2000
#1	c	32	3500


- (3) 结果。

- 相信整个过程并不难理解,上面演示的是同一个键下,两个表对应只有一条数据的情况(一个用户对应一条消费记录)。
- 那么,如果一个用户对应了多条消费记录的话,那又是怎么拼接的呢?
- 假设现在的数据变成了下面这个样子,在 df_2 中,有两条和 a 对应的数据:
- 我们同样用 inner 的方式进行 merge:
df_1 = pd.DataFrame({
"userid":['a', 'b', 'c', 'd'],
"age":[23, 46, 32, 19]
})
df_2 = pd.DataFrame({
"userid":['a', 'c','a', 'd'],
"payment":[2000, 3500, 500, 1000]
})
pd.merge(df_1, df_2, on="userid")
#userid age payment
#0 a 23 2000
#1 a 23 500
#2 c 32 3500
#3 d 19 1000
2. left 和 right
- left 和 right 的 merge 方式其实是类似的,分别被称为左连接和右连接。这两种方法是可以互相转换的,所以在这里放在一起介绍。
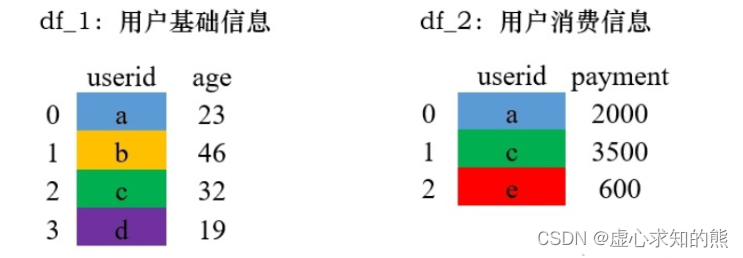
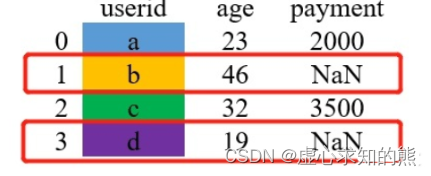
- left 在 merge 时,以左边表格的键为基准进行配对,如果左边表格中的键在右边不存在,则用缺失值 NaN 填充。
- right 在 merge 时,以右边表格的键为基准进行配对,如果右边表格中的键在左边不存在,则用缺失值 NaN 填充。
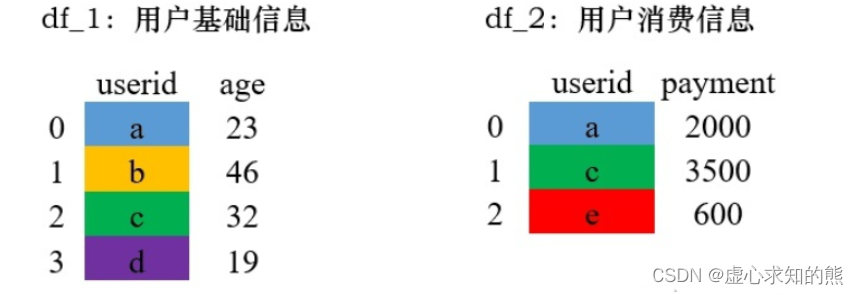
- 这是什么意思呢?我们用一个例子来具体解释一下,这是演示的数据。
- 现在用 left 的方式进行 merge。
df_1 = pd.DataFrame({
"userid":['a', 'b', 'c', 'd'],
"age":[23, 46, 32, 19]
})
df_2 = pd.DataFrame({
"userid":['a', 'c','e'],
"payment":[2000, 3500, 600]
})
pd.merge(df_1, df_2,how='left', on="userid")
#userid age payment
#0 a 23 2000.0
#1 b 46 NaN
#2 c 32 3500.0
#3 d 19 NaN

pd.merge(df_1, df_2,how='right', on="userid")
#userid	age	payment
#0	a	23.0	2000
#1	c	32.0	3500
#2	e	NaN	600
3. outer
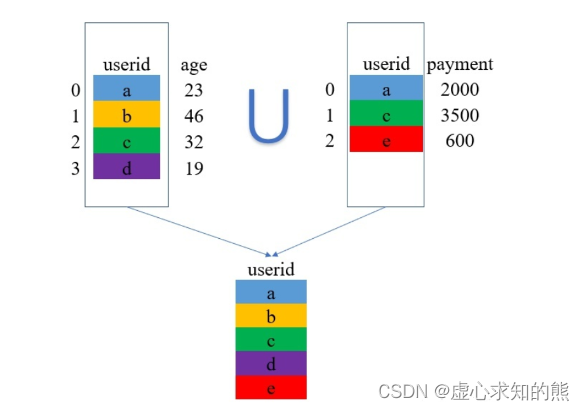
pd.merge(df_1, df_2,how='outer',on='userid')
#userid	age	payment
#0	a	23.0	2000.0
#1	b	46.0	NaN
#2	c	32.0	3500.0
#3	d	19.0	NaN
#4	e	NaN	600.0
二、set_index() 函数
DataFrame.set_index(keys, drop=True, append=False, inplace=False, verify_integrity=False)
- 其参数含义如下:
- keys 表示要设置为索引的列名(如有多个应放在一个列表里)。
- drop 表示将设置为索引的列删除,默认为 True。
- append 表示是否将新的索引追加到原索引后(即是否保留原索引),默认为 False。
- inplace 表示是否在原 DataFrame 上修改,默认为 False。
- verify_integrity 表示是否检查索引有无重复,默认为 False。
- 首先,我们生成初始数据。
df = pd.DataFrame({'month': [1, 4, 7, 10],
                   'year': [2012, 2014, 2013, 2014],
                   'sale': [55, 40, 84, 31]})
df
#	month	year	sale
#0	1	2012	55
#1	4	2014	40
#2	7	2013	84
#3	10	2014	31
- 我们将索引设置为 month 列:
df.set_index('month')
	year	sale
month
#1	2012	55
#4	2014	40
#7	2013	84
#10	2014	31
df.set_index('month',drop=False)
#   month	year	sale
#month
#1	1	2012	55
#4	4	2014	40
#7	7	2013	84
#10	10	2014	31
- 我们保留原来的 index 列。
df.set_index('month', append=True)
df.loc[0]
#month       1
#year     2012
#sale       55
#Name: 0, dtype: int64
df.set_index('month', inplace=True)
df
#	year	sale
#month
#1	2012	55
#4	2014	40
#7	2013	84
#10	2014	31
df.set_index(pd.Series(range(4)))
#year	sale
#0	2012	55
#1	2014	40
#2	2013	84
#3	2014	31
三、drop_duplicates() 函数
- 去重通过字面意思不难理解,就是删除重复的数据。
- 在一个数据集中,找出重复的数据删并将其删除,最终只保存一个唯一存在的数据项,这就是数据去重的整个过程。
- 删除重复数据是数据分析中经常会遇到的一个问题。通过数据去重,不仅可以节省内存空间,提高写入性能,还可以提升数据集的精确度,使得数据集不受重复数据的影响。
- Panda DataFrame 对象提供了一个数据去重的函数 drop_duplicates()。
- 其语法模板如下:
DataFrame.drop_duplicates(subset=None, keep='first', inplace=False, ignore_index=False)
- 其部分参数含义如下:
- subset 表示要进去重的列名,默认为 None。
- keep 有三个可选参数,分别是 first、last、False,默认为 first,表示只保留第一次出现的重复项,删除其余重复项,last 表示只保留最后一次出现的重复项,False 则表示删除所有重复项。
- inplace 为布尔值参数,默认为 False 表示删除重复项后返回一个副本,若为 Ture 则表示直接在原数据上删除重复项。
- 我们先生成初始数据,用以后续的观察操作。
df = pd.DataFrame({
'brand': ['Yum Yum', 'Yum Yum', 'Indomie', 'Indomie', 'Indomie'],
'style': ['cup', 'cup', 'cup', 'pack', 'pack'],
'rating': [4, 4, 3.5, 15, 5]
})
df
#brand style rating
#0 Yum Yum cup 4.0
#1 Yum Yum cup 4.0
32 Indomie cup 3.5
#3 Indomie pack 15.0
#4 Indomie pack 5.0
- 在默认情况下,它会基于所有列删除重复的行。
df.drop_duplicates()
#brand	style	rating
#0	Yum Yum	cup	4.0
#2	Indomie	cup	3.5
#3	Indomie	pack	15.0
#4	Indomie	pack	5.0
- 我们删除特定列上的重复项,使用子集。
df.drop_duplicates(subset=['brand'])
#brand	style	rating
#0	Yum Yum	cup	4.0
#2	Indomie	cup	3.5
- 我们删除重复项并保留最后出现的项,使用保留。
df.drop_duplicates(subset=['brand', 'style'], keep='last')
#brand	style	rating
#1	Yum Yum	cup	4.0
#2	Indomie	cup	3.5
#4	Indomie	pack	5.0
四、tolist() 函数
df.index
#RangeIndex(start=0, stop=5, step=1)
df.index.tolist()
#[0, 1, 2, 3, 4]
五、视频数据分析案例
1. 问题要求
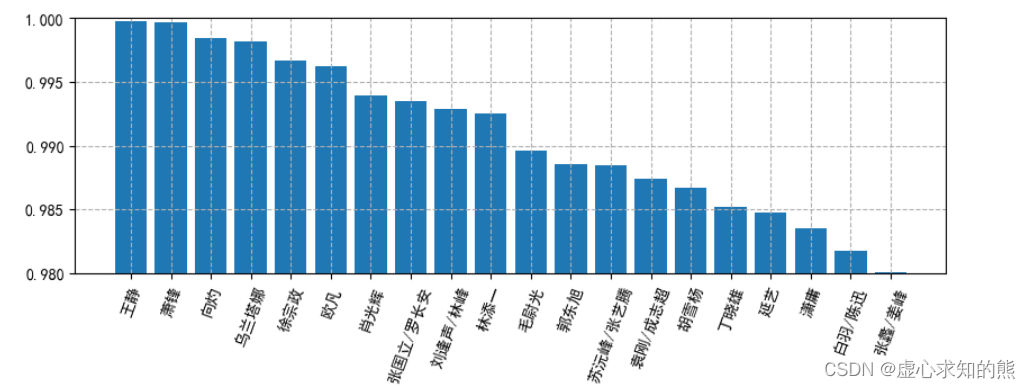
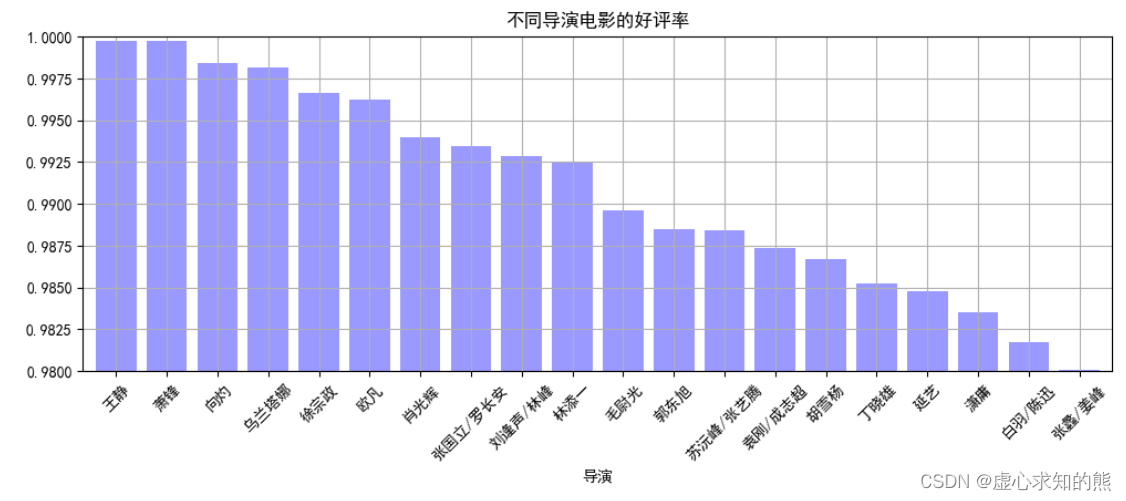
- 问题 1:分析出不同导演电影的好评率,并筛选出 TOP20。
- 要求:
- (1) 计算统计出不同导演的好评率。
- (2) 通过多系列柱状图,做图表可视化。
- 提示:
- (1) 好评率 = 好评数 / 评分人数。
- (2) 可自己设定图表风格。
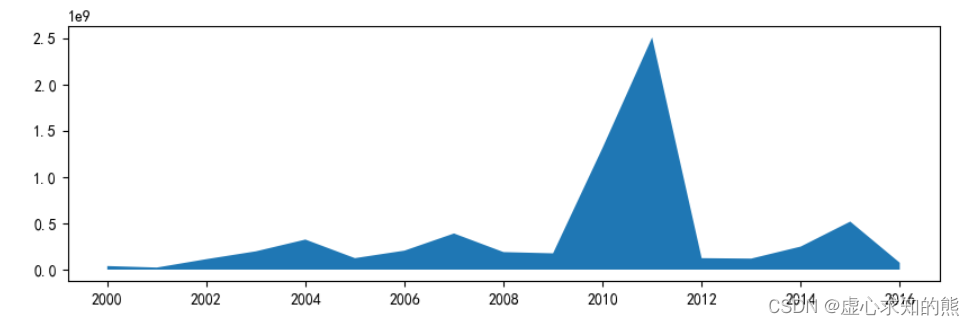
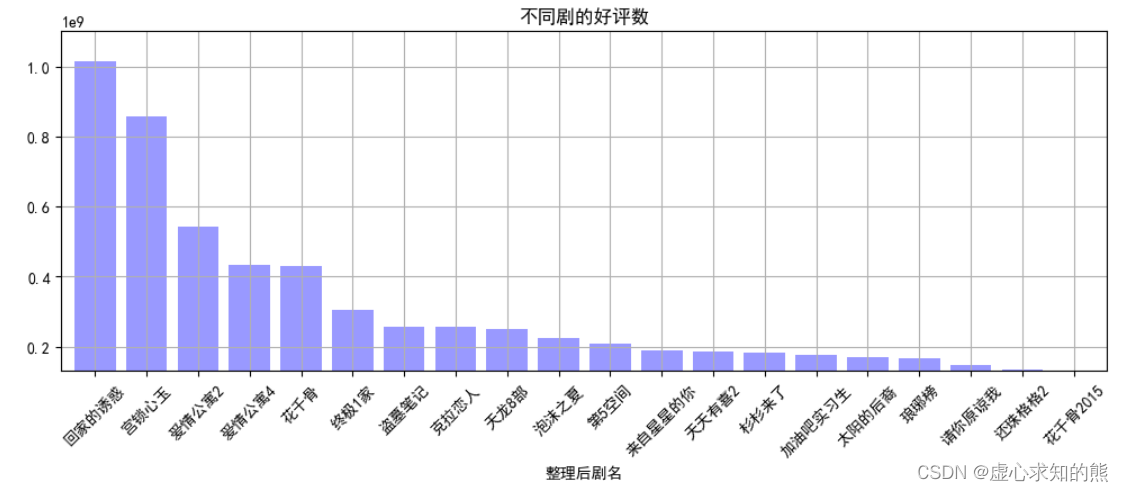
- 问题 2: 统计分析 2001-2016 年每年评影人数总量,求出不同剧的评分人数、好评数总和。
2. 解决过程
- 首先,我们导入 numpy 和 pandas 库,由于要进行图表可视化,因此,我们再导入 matplotlib 库。
import numpy as np
import pandas as pd
from matplotlib import pyplot as plt
data = pd.read_csv('爱奇艺视频数据.csv',encoding="gbk")
data.info()
#<class 'pandas.core.frame.DataFrame'>
#RangeIndex: 99999 entries, 0 to 99998
#Data columns (total 24 columns):
# #   Column  Non-Null Count  Dtype
#---  ------  --------------  -----
# 0   数据获取日期  99999 non-null  object
# 1   演员      97981 non-null  object
# 2   视频ID    99999 non-null  object
# 3   详细链接    99998 non-null  object
# 4   剧名      99999 non-null  object
# 5   状态      99158 non-null  object
# 6   类型      99999 non-null  object
# 7   来源平台    99999 non-null  object
# 8   整理后剧名   99999 non-null  object
# 9   更新时间    644 non-null    object
# 10  上映时间    78755 non-null  float64
# 11  语言      85926 non-null  object
# 12  评分      99970 non-null  float64
# 13  地区      98728 non-null  object
# 14  上映年份    78755 non-null  float64
# 15  简介      99970 non-null  object
# 16  导演      97614 non-null  object
# 17  差评数     99970 non-null  float64
# 18  评分人数    99970 non-null  float64
# 19  播放量     99453 non-null  float64
# 20  更新至     1272 non-null   float64
# 21  总集数     98871 non-null  float64
# 22  第几季     99999 non-null  int64
# 23  好评数     99970 non-null  float64
#dtypes: float64(9), int64(1), object(14)
#memory usage: 18.3+ MB
- pandas 读取 csv 文件默认是按块读取的,即不一次性全部读取。
- 另外 pandas 对数据的类型是完全靠猜的,所以 pandas 每读取一块数据就对 csv 字段的数据类型进行猜一次,所以有可能 pandas在读取不同块时对同一字段的数据类型猜测结果不一致。
- low_memory=False 参数设置后,pandas 会一次性读取 csv 中的所有数据,然后对字段的数据类型进行唯一的一次猜测。这样就不会导致同一字段的 Mixed types 问题了。
- 但是这种方式真的非常不好,一旦 csv 文件过大,就会内存溢出;所以推荐用第 1 中解决方案。
- (1) 设置 read_csv 的 dtype 参数,指定字段的数据类型。
pd.read_csv(sio, dtype={"user_id": int, "username": object})
pd.read_csv(sio, low_memory=False})
data.head(3)
data.columns
#Index(['数据获取日期', '演员', '视频ID', '详细链接', '剧名', '状态', '类型', '来源平台', '整理#后剧名',
#       '更新时间', '上映时间', '语言', '评分', '地区', '上映年份', '简介', '导演', '差评数', #'评分人数',
#       '播放量', '更新至', '总集数', '第几季', '好评数'],
#      dtype='object')
- 我们计算统计出不同导演的好评率。
data.groupby('导演')[['好评数','评分人数']].sum()
#好评数	评分人数
#导演
#Exact	375172.0	458543.0
#John Fawcett Steve Dimarco Paul Fox	1477942.0	1729878.0
#Michael Cuesta	527348.0	604104.0
#Michael Dinner	1032245.0	1312847.0
#Michael Engler	47804.0	61844.0
#...	...	...
#龚朝	4634.0	8620.0
#龚朝/杨巧文/王伟仁	676160.0	964912.0
#龚朝晖	4044245.0	5941895.0
#龚艺群	194079.0	290358.0
#龚若飞	29126.0	43151.0
#1196 rows × 2 columns
- 新增好评率。
df_q1 = data.groupby('导演').sum()[['好评数','评分人数']]
df_q1['好评率'] = df_q1['好评数']/df_q1['评分人数']
df_q1
#好评数	评分人数	好评率
#导演
#Exact	375172.0	458543.0	0.818183
#John Fawcett Steve Dimarco Paul Fox	1477942.0	1729878.0	0.854362
#Michael Cuesta	527348.0	604104.0	0.872942
#Michael Dinner	1032245.0	1312847.0	0.786265
#Michael Engler	47804.0	61844.0	0.772977
#...	...	...	...
#龚朝	4634.0	8620.0	0.537587
#龚朝/杨巧文/王伟仁	676160.0	964912.0	0.700748
#龚朝晖	4044245.0	5941895.0	0.680632
#龚艺群	194079.0	290358.0	0.668413
#龚若飞	29126.0	43151.0	0.674979
#1196 rows × 3 columns
- 我们筛选出 TOP20。
result_q1 = df_q1.sort_values('好评率',ascending=False)[:20]
result_q1
- 由于要画图,对图的一些属性进行设置。
# 设置中文:
# 设置中文字体
plt.rcParams['font.sans-serif'] = ['SimHei']
# 中文负号
plt.rcParams['axes.unicode_minus'] = False
# 设置分别率 为100
plt.rcParams['figure.dpi'] = 100
# 设置大小
plt.rcParams['figure.figsize'] = (10,3)
# 绘制图形
plt.bar(result_q1.index,result_q1['好评率'])
# 设置y轴范围
plt.ylim(0.98,1)
# 设置x轴文字倾斜
plt.xticks(rotation=70)
# 设置网格
plt.grid(True, linestyle='--')
result_q1['好评率'].plot(kind='bar',
       color = 'b',
       width = 0.8,
       alpha = 0.4,
       rot = 45,
       grid = True,
       ylim = [0.98,1],
       figsize = (12,4),
       title = '不同导演电影的好评率')
movie_year = data.groupby('上映年份')[['评分人数']].sum()
movie_year_2000 = movie_year.loc[2000:]
plt.stackplot(movie_year_2000.index,movie_year_2000['评分人数'])
movie_title_group = data.groupby('整理后剧名')[['评分人数','好评数']].sum()
result_title = movie_title_group.sort_values('好评数',ascending=False)[:20]
result_title
result_title['好评数'].plot(kind='bar',
       color = 'b',
       width = 0.8,
       alpha = 0.4,
       rot = 45,
       grid = True,
       ylim = [1.3e+08,1.1e+09],
       figsize = (12,4),
       title = '不同剧的好评数')
原文地址:https://blog.csdn.net/weixin_45891612/article/details/129249474
本文来自互联网用户投稿,该文观点仅代表作者本人,不代表本站立场。本站仅提供信息存储空间服务,不拥有所有权,不承担相关法律责任。
如若转载,请注明出处:http://www.7code.cn/show_11801.html
如若内容造成侵权/违法违规/事实不符,请联系代码007邮箱:suwngjj01@126.com进行投诉反馈,一经查实,立即删除!
主题授权提示:请在后台主题设置-主题授权-激活主题的正版授权,授权购买:RiTheme官网
声明:本站所有文章,如无特殊说明或标注,均为本站原创发布。任何个人或组织,在未征得本站同意时,禁止复制、盗用、采集、发布本站内容到任何网站、书籍等各类媒体平台。如若本站内容侵犯了原著者的合法权益,可联系我们进行处理。

