Visualize Data by Adding Charts to WPF Spreadsheets
Transform complex data into compelling visualizations using .NET WPF spreadsheet components. Enhance data analysis and insights with interactive charts and graphs.
Charts are integral to spreadsheets, enabling users to transform data into visually compelling representations. These graphical formats, such as pie, line, bar, and area charts, effectively convey complex information by highlighting trends, patterns, and anomalies. Spreadsheet software with advanced charting capabilities empowers users to create dynamic charts that adapt seamlessly to data updates, making them invaluable tools for reporting, presentations, and data analysis.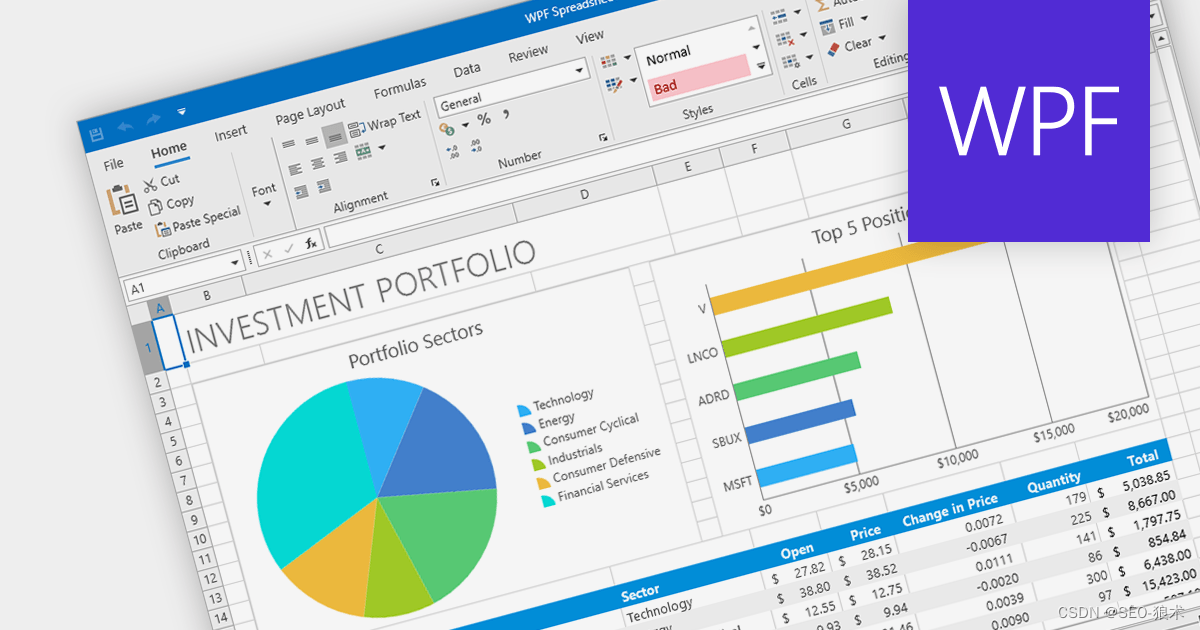
Several .NET WPF spreadsheet components provide chart support including:
DevExpress WPF Spreadsheet (Part of DevExpress WPF) helps you visualize spreadsheet data effectively with a comprehensive collection of charts for WPF.
Infragistics WPF Spreadsheet (Part of Infragistics Ultimate UI for WPF) enhances WPF spreadsheet data analysis and insights with a wide range of customizable charts and graphs.
Spread.NET WPF by MESCIUS (formerly GrapeCity) creates impactful data visualizations with a variety of built-in charts for WPF spreadsheets.