color设置的颜色

option = {
    color:['blue','pink','lightyellow','orange','lightblue'],
    series: [
        {
            name: '访问来源',
            type: 'pie',
            radius: ['40%', '70%'],
            label: {
                show: false,
                position: 'center'
            },
            labelLine: {
                show: false
            },
            data: [
                {value: 1048, name: '搜索引擎'},
                {value: 735, name: '直接访问'},
                {value: 580, name: '邮件营销'},
                {value: 484, name: '联盟广告'},
                {value: 300, name: '视频广告'}
            ]
        }
    ]
};环形渐变色

option = {
    series: [
        {
            name: '访问来源',
            type: 'pie',
            radius: ['40%', '70%'],
            data: [
                {
                    value: 335,
                    name: '直接访问',
                    itemStyle: {
                        color: {
                            colorStops: [{
                                    offset: 0,
                                    color: '#ff7474 ' // 0% 处的颜色
                                }, {
                                    offset: 1,
                                    color: '#4176ff' // 100% 处的颜色
                                }]
                        }
                    }
                },
                {
                    value: 310,
                    name: '邮件营销',
                    itemStyle: {
                        color: {
                            colorStops: [{
                                    offset: 0,
                                    color: '#ffe390' // 0% 处的颜色
                                }, {
                                    offset: 1,
                                    color: '#f7c222' // 100% 处的颜色
                                }]
                        }
                    }
                },

            ]
        }
    ]
};圆环中间显示文字

option = {
  title : {
    show:true,
    text: '充电方式', // n可以换行
    x:'50%', // center
    y: 'center',
    textAlign: 'center',
    textStyle: {
      fontSize: '16',
      fontStyle: 'normal',
      fontWeight: '600',
      lineHeight: '28',
      color:'#333'
    },
  },
  series: [
    {
      type:'pie',
      radius: ['30%', '40%'],
      label: {
        normal: {
            show: false,
        },
        emphasis: {
            show: true,
        }
      },
      data: [
          {value: 1048, name: '搜索引擎'},
          {value: 735, name: '直接访问'},
          {value: 580, name: '邮件营销'},
          {value: 484, name: '联盟广告'},
          {value: 300, name: '视频广告'}
      ]
    }
  ]
};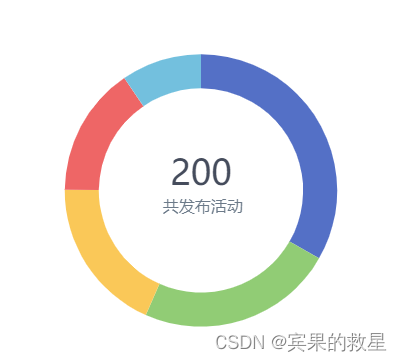
option = {
  series: [
    {
      type:'pie',
      radius: ['30%', '40%'],
      center: ['50%', '50%'],
      avoidLabelOverlap: false,
      label: {
        normal: {
          show: true,
          position: 'center',
          color:'#4c4a4a',
          formatter: '{total|' + 200 +'}'+ 'nr' + '{active|共发布活动}',
          rich: {
            total:{
              fontSize: 35,
              fontFamily : "微软雅黑",
              color:'#454c5c'
            },
            active: {
              fontFamily : "微软雅黑",
              fontSize: 16,
              color:'#6c7a89',
              lineHeight:30,
            },
          }
        },
        emphasis: {//中间文字显示
          show: true,
        }
      },
      data: [
        {value: 1048, name: '搜索引擎'},
        {value: 735, name: '直接访问'},
        {value: 580, name: '邮件营销'},
        {value: 484, name: '联盟广告'},
        {value: 300, name: '视频广告'}
      ]
    }
  ]
};
var i = 0;
var colors=['#5AC8FA','#4BD964','#A16EFF','#FF2D55','#FF9600','#CDCED1'];
option = {
  // 圆环中间的文字
  graphic:[
    {
      type:'text',
      left:'center',
      top:'45%',
      style:{
        text:'标题',
        fill:'#000',
        width:30,
        height:30,
        fontSize:30,
      }
    },
    {
      type:'text',
      left:'center',
      top:'55%',
      style:{
        text:'文本',
        fill:'#969696',
        width:30,
        height:30,
        fontSize:24,
      }
    }
  ],
  series : [
    {
      type:'pie',
      radius: ['45%', '60%'],
      avoidLabelOverlap: false,
      itemStyle:{
        normal:{
          color:function(){
            return colors[i++]
          },
          // 白色间距
          borderWidth: 6,
          borderColor: '#ffffff',
        }
      },
      label: {
        normal: {
          show: false,
        },
        emphasis: {
          show: false,
        }
      },
      labelLine: {
        normal: {
          show: false
        }
      },
      data:[1,2,3,4]
    }
  ]
}悬浮显示中间文字
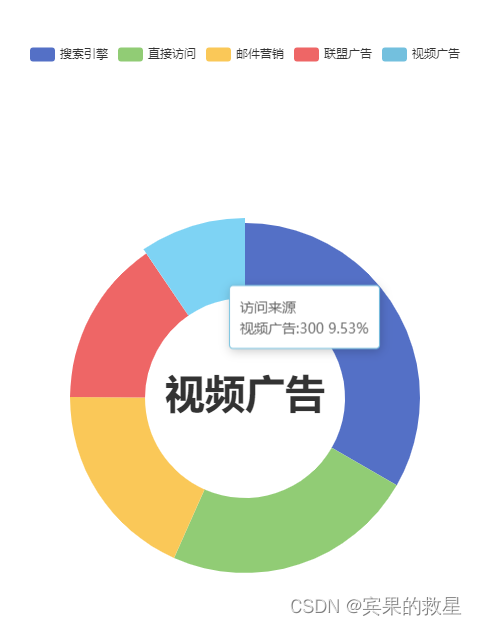
option = {
  tooltip: {
    trigger: 'item',
    formatter:'{a}<br/>{b}:{c} {d}%'
  },
  legend: {
    top: '5%',
    left: 'center'
  },
  series: [
    {
      name: '访问来源',
      type: 'pie',
      radius: ['30%', '40%'],
      avoidLabelOverlap: false,
      label: {
        show: false,
        position: 'center'
      },
      emphasis: {
        label: {
          show: true,
          fontSize: '30',
          fontWeight: 'bold'
        }
      },
      labelLine: {
        show: false
      },
      data: [
        {value: 1048, name: '搜索引擎'},
        {value: 735, name: '直接访问'},
        {value: 580, name: '邮件营销'},
        {value: 484, name: '联盟广告'},
        {value: 300, name: '视频广告'}
      ]
    }
  ]
};悬浮显示中间文字,默认显示第一个

var myChart = echarts.init(document.getElementById('chart-container'), null, {
  renderer: 'canvas',
  useDirtyRect: false
});

window.addEventListener('resize', myChart.resize);

var data= [
  { value: 1048, name: 'Search Engine' },
  { value: 735, name: 'Direct' },
  { value: 580, name: 'Email' },
  { value: 484, name: 'Union Ads' },
  { value: 300, name: 'Video Ads' }
]

var keys = Object.keys(data)

var option = {
  series: [
    {
      name: 'Access From',
      type: 'pie',
      radius: ['40%','60%'],
      hoverOffset: 20,
      label: {
        normal: {
          show: false,
          position: 'center'
        },
        emphasis: {
          show: true,
          textStyle:{
            fontSize: '20'
          }
        }
      },
      data: data,
    }
  ]
};

if (option && typeof option === 'object') {

  myChart.setOption(option);

  // 默认第一个高亮
  myChart.dispatchAction({
    type:'highlight',
    seriesIndex: 0,
    dataIndex: 0
  })

  myChart.on('mouseover',function(e){
    // 取消所有高亮
    myChart.dispatchAction({
      type:'downplay',
      seriesIndex: 0,
      dataIndex: keys
    })
    // 当前高亮
    myChart.dispatchAction({
      type:'highlight',
      seriesIndex: 0,
      dataIndex: e.dataIndex
    })
  })
  myChart.on('mouseout',function(e){
    // 取消所有高亮
    myChart.dispatchAction({
      type:'downplay',
      seriesIndex: 0,
      dataIndex: keys
    })
    // 第一个高亮
    myChart.dispatchAction({
      type:'highlight',
      seriesIndex: 0,
      dataIndex: 0
    })
  })
}循环高亮饼图块
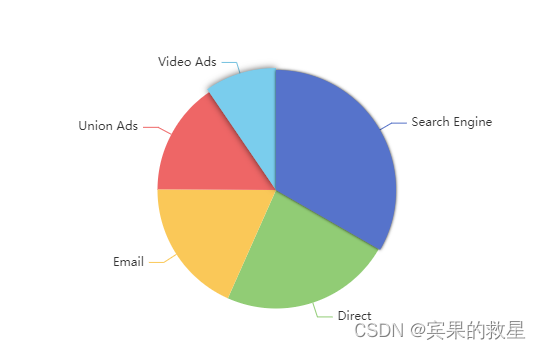
var myChart = echarts.init(document.getElementById('chart-container'), null, {
  renderer: 'canvas',
  useDirtyRect: false
});

window.addEventListener('resize', myChart.resize);

var option = {
  series: [
    {
      name: 'Access From',
      type: 'pie',
      radius: '50%',
      data: [
        { value: 1048, name: 'Search Engine' },
        { value: 735, name: 'Direct' },
        { value: 580, name: 'Email' },
        { value: 484, name: 'Union Ads' },
        { value: 300, name: 'Video Ads' }
      ],
      emphasis: {
        itemStyle: {
          shadowBlur: 10,
          shadowOffsetX: 0,
          shadowColor: 'rgba(0, 0, 0, 0.5)'
        }
      }
    }
  ]
};

if (option && typeof option === 'object') {
  myChart.setOption(option);

  timeSetIntervalFun()
}

var currentIndex = 0
function timeSetIntervalFun() {
  timeSetInterval = setInterval(function() {
    var dataLen = option.series[0].data.length;

    // 取消之前高亮的图形
    myChart.dispatchAction({
      type: 'downplay',
      seriesIndex: 0,
      dataIndex: currentIndex
    });

    currentIndex = (currentIndex + 1) % dataLen;

    // 高亮当前块
    myChart.dispatchAction({
      type: 'highlight',
      seriesIndex: 0,
      dataIndex: currentIndex
    });

  }, 2000);

}

myChart.on('mouseover', function(e) {
  clearInterval(timeSetInterval)

  //取消默认选中高亮
  myChart.dispatchAction({
    type: 'downplay',
    seriesIndex: 0,
    dataIndex: currentIndex
  });

  //高亮当前块
  myChart.dispatchAction({
    type: 'highlight',
    seriesIndex: 1,
    dataIndex: e.dataIndex
  });

  currentIndex = e.dataIndex;
});


myChart.on('mouseout', function(e) {
  timeSetIntervalFun()

  // 第一个高亮
  myChart.dispatchAction({
    type: 'highlight',
    seriesIndex: 1,
    dataIndex: 0
  });

});label文字过长重叠

option = {
series: [
{
type: 'pie',
clickable:false, // 是否开启点击
minAngle: 15, // 最小扇区角度(0 ~ 360),防止扇区太小影响交互
startAngle:45, // 起始角度
avoidLabelOverlap: true, // 是否启用防止标签重叠策略
hoverAnimation:false, // 是否开启 hover 在扇区上的放大动画效果。
silent: true, // 图形是否不响应和触发鼠标事件
radius: ['20%', '30%'],
center: ['50%', '50%'],
label: {
show: true,
fontSize: '16',
align: 'left',
formatter(v) {
console.log(v)
let text = v.name
if(text.length <= 8){
return text;
}else if(text.length > 8 && text.length <= 16){
return text = `${text.slice(0,8)}n${text.slice(8)}`
}else if(text.length > 16 && text.length <= 24){
return text = `${text.slice(0,8)}n${text.slice(8,16)}n${text.slice(16)}`
}else if(text.length > 24 && text.length <= 30){
return text = `${text.slice(0,8)}n${text.slice(8,16)}n${text.slice(16,24)}n${text.slice(24)}`
}else if(text.length > 30){
return text = `${text.slice(0,8)}n${text.slice(8,16)}n${text.slice(16,24)}n${text.slice(24,30)}n${text.slice(30)}`
}
}
},
labelLine: {
show: false
},
data: [
{ value: 1, name: '一二三四五六七八九十' },
{ value: 735, name: '一二三四五六' },
{ value: 580, name: '一二三四五六七八九十一二三四五六七八九十一二三四五六七八九十' },
{ value: 484, name: '一二三四五六七八九十一二三四五六七八九十' },
{ value: 300, name: '一二三四五六七八九十一二' }
]
}
]
};label和饼图一致

let colorList = ['lightgreen','pink','purple','orange','lightblue']
let dataList = [
  { value: 1048, name: 'Search Engine'},
  { value: 735, name: 'Direct' },
  { value: 580, name: 'Email' },
  { value: 484, name: 'Union Ads' },
  { value: 300, name: 'Video Ads' }
]
option = {
  series: [
    {
      type: 'pie',
      radius: ['20%','30%'],
      color: colorList,
      data: dataList.map((item, index) => {
        item.label = {
          // 第一种方法
          color: colorList[index],
          // 第二种方法
          color: 'inherit'
        }
        return item
      }),
    }
  ]
};label展示位置

option = {
    series: [{
        name: '访问来源',
        type: 'pie',
        radius: '55%',
        center: ['50%', '50%'],
        label: {
            show: true,
            position: 'inside'
        },
        labelLine: {
            show: false,
        },
        data: [
            {
                value: 335,
                name: '良好'
            },
            {
                value: 135,
                name: '不及格',
                label: {
                    show: true,
                    position: 'outside'
                },
                labelLine: {
                    show: true,
                    smooth: true,
                    lineStyle: {
                        color: 'red'
                    }
                }
            },
            {
                value: 1548,
                name: '优秀优秀优秀优秀优秀',
                label: {
                    formatter: function (params) {
                        if (params.data.name.length > 5) {
                            var labelNewText = params.data.name.substring(0, 6) + ' ...'
                        }
                        return labelNewText
                    }
                }
            }
        ],
        itemStyle: {
            emphasis: {
                shadowBlur: 10,
                shadowOffsetX: 0,
                shadowColor: 'rgba(0, 0, 0, 0.5)'
            }
        }
    }]
};内容为0仍然显示扇区
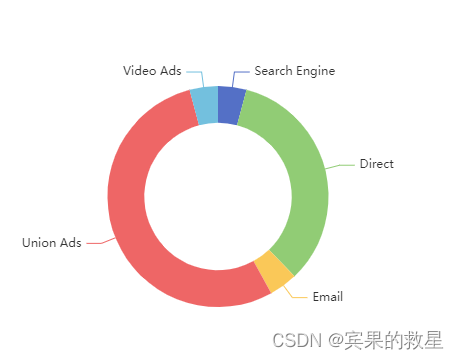
option = {
  series: [
    {
      type: 'pie',
      radius: ['20%','30%'],
      minAngle: 15,  // 最小的扇区角度(0 ~ 360),用于防止某个值过小导致扇区太小影响交互
      avoidLabelOverlap: true,   // 是否启用防止标签重叠策略
      data: [
        { value: 0, name: 'Search Engine' },
        { value: 25, name: 'Direct' },
        { value: 0, name: 'Email' },
        { value: 40, name: 'Union Ads' },
        { value: 0, name: 'Video Ads' }
      ],
    }
  ]
};圆角环形图

option = {
  series: [
    {
      type: 'pie',
      radius: ['30%', '45%'],
      avoidLabelOverlap: false,
      itemStyle: {
        borderRadius: 50,
        borderColor: '#fff',
        borderWidth: 30
      },
      label:{
        show: false
      },
      data: [
        { value: 1048, name: 'Search Engine' },
        { value: 735, name: 'Direct' },
        { value: 580, name: 'Email' },
        { value: 484, name: 'Union Ads' },
        { value: 300, name: 'Video Ads' }
      ]
    }
  ]
};仿3D环形图
silent: true实现内部浅色圆环不触发事件,完全没有效果。
emphasis:实现内部浅色圆环不触发事件,但是显示tooltip。
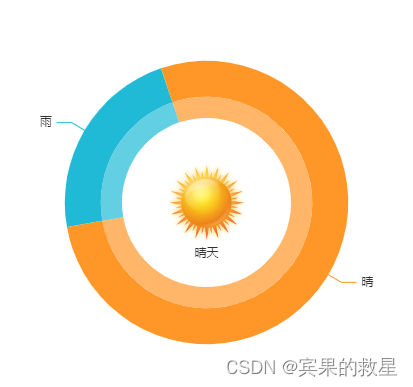
let colors = ["#21BAD6", "#FF9728"];
var img = 'https://echarts.apache.org/examples/data/asset/img/weather/sunny_128.png';
option = {
  color: colors,
  tooltip: {
    trigger: "item",
    backgroundColor: "rgba(0,0,0,.6)",
    borderColor: "rgba(147, 235, 248, .8)",
    textStyle: {
      color: "#FFF",
    },
  },
  graphic: [
    {
      type: "image",
      style: {
        image: img,
        width: 80,
        height: 80,
        color: "#fff",
      },
      left: "center",
      top: "center",
    },
    {
      type: "text",
      left: "center",
      top: "60%",
      style: {
        text: "晴天",
        fill: "#333",
        width: 30,
        height: 30,
        fontSize: 12,
      },
    },
  ],
  series: [
    {
      minAngle: 15, //扇区最小角度
      startAngle: 190, //扇区起始角度
      name: "天气分析",
      type: "pie",
      avoidLabelOverlap: true,
      legendHoverLink: true,
      radius: ["50%", "67%"],
      data: [
        {
          value: 14,
          name: "雨",
        },
        {
          value: 48,
          name: "晴",
        },
      ],
    },
    {
      minAngle: 15, //扇区最小角度
      startAngle: 190, //扇区起始角度
      name: "天气分析",
      type: "pie",
      avoidLabelOverlap: true,
      legendHoverLink: true,
      radius: ["40%", "50%"],
      data: [
        {
          value: 14,
          name: "雨",
        },
        {
          value: 48,
          name: "晴",
        },
      ],


      // 点击不放大
      silent: true,
      // 点击不放大,但是显示tooltip
      emphasis:{//使用emphasis
         disable:false,
         scale:false,//不缩放
         scaleSize:0,//为了防止失效直接设置未0
      },

      itemStyle: {
        opacity: 0.7,
      },
      label:{
        show: false
      }
    }
  ],
};参考链接: Echarts饼图,环形图,鼠标触碰后取消默认放大效果_
label带小圆点
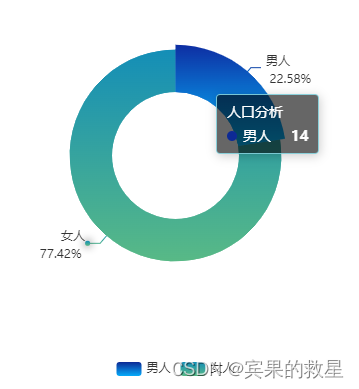
let colors = [
  new echarts.graphic.LinearGradient(0, 0, 0, 1, [
    { offset: 0, color: "#0D2A95" },
    { offset: 1, color: "#05ABFA" },
  ]),
  new echarts.graphic.LinearGradient(0, 0, 0, 1, [
    { offset: 0, color: "#148eb7" },
    { offset: 1, color: "#58b986" },
  ]),
];

// 数据
let data = {
  name: "人口分析",
  type: "pie",
  radius: "65%",
  avoidLabelOverlap: true,
  legendHoverLink: true,
  color: colors,
  data: [
    {
      value: 14,
      name: "男人",
      label: {
        shadowColor: colors[2],
      },
    },
    {
      value: 48,
      name: "女人",
      label: {
        shadowColor: colors[1],
      },
    },
  ],
}

option = {
  tooltip: {
    trigger: "item",
    backgroundColor: "rgba(0,0,0,.6)",
    borderColor: "rgba(147, 235, 248, .8)",
    textStyle: {
      color: "#FFF",
    },
  },
  legend: {
    show: true,
    bottom: "0",
    left: "center",
    textStyle: {
      color: "#333",
    },
  },
  series: [
    {
      ...data,

      // label 文字的设置
      label: {
        formatter: "{b|{b}}n {per|{d}% }",
        rich: {
          b: {
            color: "#333",
            fontSize: 12,
            lineHeight: 24,
          },
          per: {
            color: "#333",
            fontSize: 12,
          },
        },
      },

      // label 线条的设置
      labelLine: {
        length: 10, // 第一段线 长度
        length2: 10, // 第二段线 长度
        show: true,
        emphasis: {
          show: true,
        },
      },
    },

    // label 圆点的设置
    {
      ...data,
      label: {
        backgroundColor: "auto", //圆点颜色,auto:映射的系列色
        height: 0,
        width: 0,
        lineHeight: 0,
        borderRadius: 2.5,
        shadowBlur: 8,
        shadowColor: "auto",
        padding: [2.5, -2.5, 2.5, -2.5],
      },
      labelLine: {
        length: 10, // 第一段线 长度
        length2: 10, // 第二段线 长度
        show: false,
      },
    },
  ],
}label超出边界显示不全
百分比圆环图
女孩的占比30%

// girl的占比
let girl = 300;
let boy = 700;
let total = 1000;
let per = 30; // per = ((300/1000)*100)*100
let color =[
  new echarts.graphic.LinearGradient(0, 0, 0, 1, [
    { offset: 0, color: "#17DFFD" },
    { offset: 1, color: "#123E83" },
  ]),
  '#f1f1f1',
];
option = {
  color: color,
  graphic:[
    {
      type:'text',
      left:'center',
      top:'43%',
      style:{
        text: girl,
        textAlign: "center",
        fill: color[0],
        fontSize: 32,
      }
    },
    {
      type:'text',
      left:'center',
      top:'52%',
      style:{
        text: `女生占比`,
        textAlign: "center",
        fill: color[0],
        fontSize: 34,
      }
    }
  ],
  series: [
    {
      type: 'pie',
      radius: ['50%','30%'],
      hoverAnimation: false,
      avoidLabelOverlap: false,
      data: [
        { value: per, name: 'per' },
        { value: 100, name: 'total' },
      ],
      label: {
        show: true,
        formatter:function(d) {
          if(d.data.name == 'per') {
            return `{value|${per}%}`
          }else {
            return ''
          }
        },
        rich:{
          value:{
            fontSize:18,
            color:color[0]
          }
        }
      }
    }
  ]
};延时动画(南丁格尔玫瑰图)

option = {
  tooltip: {
    trigger: 'item',
    formatter: '{a} <br/>{b} : {c} ({d}%)'
  },
  series: [
    {
      name: '指令',
      type: 'pie',
      radius: [20, 140],
      center: ['50%', '50%'],
      roseType: 'radius',
      data: [
        { value: 40, name: 'rose 1' },
        { value: 33, name: 'rose 2' },
        { value: 28, name: 'rose 3' },
        { value: 22, name: 'rose 4' },
        { value: 20, name: 'rose 5' },
        { value: 15, name: 'rose 6' },
        { value: 12, name: 'rose 7' },
        { value: 10, name: 'rose 8' }
      ],
      // 延时动画(渲染出来的时间)
      animationEasing: "cubicInOut",
      animationDuration: 6000,
    },
  ]
};玫瑰图数值差别大展示效果不佳
原始效果:
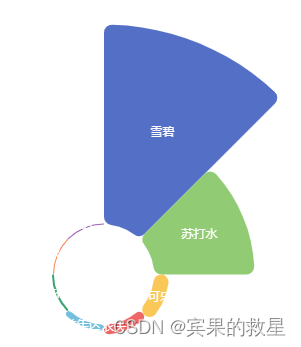
期待效果:
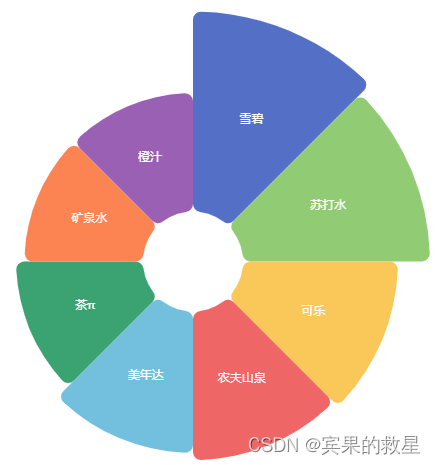
// 原始数据
let data = [
  { value: 15, name: '可乐' },
  { value: 199, name: '雪碧' },
  { value: 6, name: '美年达' },
  { value: 2, name: '茶π' },
  { value: 100, name: '苏打水' },
  { value: 1, name: '矿泉水' },
  { value: 10, name: '农夫山泉' },
  { value: 1, name: '橙汁' }
]

// 数据排序
data.sort((a, b) => b.value - a.value)

//和
let sum = 0
data.forEach(v=>{
  sum += v.value
})

// 新数据
let b = data.map((it) => {
  return {
    name: it.name,
    value: Math.pow(it.value, 0.099), // 值越大,数据差越小 最大值为0.5
  }
})

option = {
  tooltip: {
    trigger: 'item',
    backgroundColor: 'rgba(255, 255, 255, 0.7)',
    formatter: (p) => {
      let value = ''
      data.forEach((v)=> {
        if(v.name == p.name) value = v.value
      })
      return p.name + " : " + value + ' (' + ((value / sum) * 100).toFixed(2) + '%)'
    },
  },
  series: [
    {
      name: '饼图',
      type: 'pie',
      radius: [50, 250],
      center: ['50%', '50%'],
      roseType: 'area',
      itemStyle: {
        borderRadius: 8
      },
      label: {
        show: true,
        position: 'inside' ,
        color: '#fff',
      },
      labelLine: {
        show: false
      },
      data: b
    }
  ]
};原文地址:https://blog.csdn.net/wuli_youhouli/article/details/124078034
本文来自互联网用户投稿,该文观点仅代表作者本人,不代表本站立场。本站仅提供信息存储空间服务,不拥有所有权,不承担相关法律责任。
如若转载,请注明出处:http://www.7code.cn/show_12851.html
如若内容造成侵权/违法违规/事实不符,请联系代码007邮箱:suwngjj01@126.com进行投诉反馈,一经查实,立即删除!
声明:本站所有文章,如无特殊说明或标注,均为本站原创发布。任何个人或组织,在未征得本站同意时,禁止复制、盗用、采集、发布本站内容到任何网站、书籍等各类媒体平台。如若本站内容侵犯了原著者的合法权益,可联系我们进行处理。

