公司的新项目需要写这样的地图,还要能两级下钻到省,下面是我写好了的样子,我今天就是复一下盘:
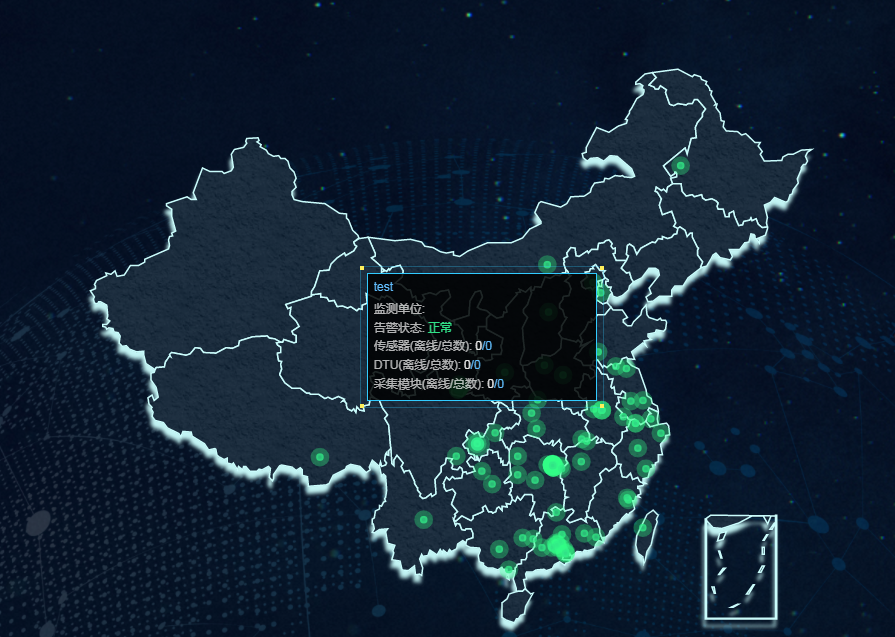
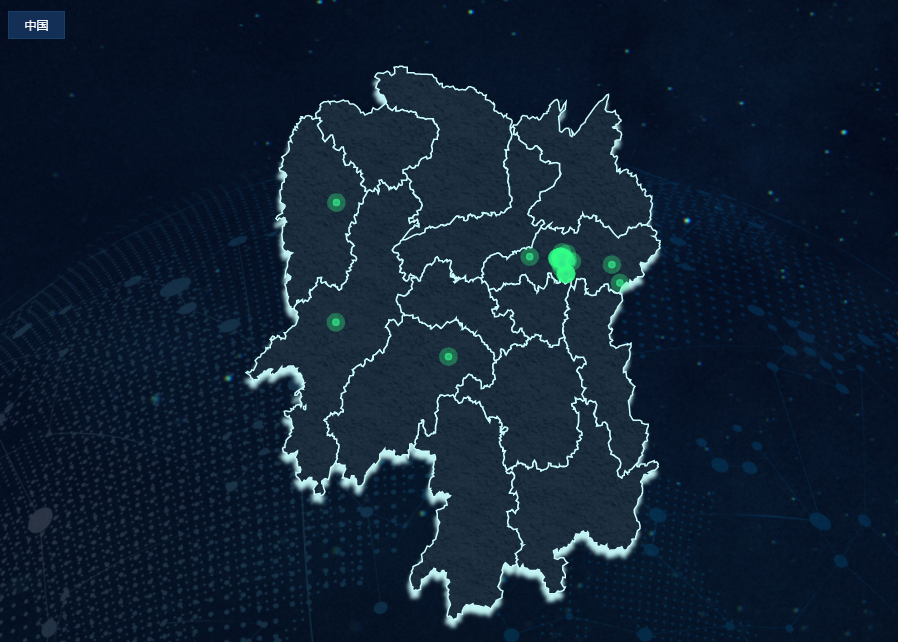
如何用echarts显示地图
首先需要下载map的Json数据,我放到这里:mapJson
然后使用echarts的geo配置,或者series的type = ‘map’就可以加载地图了:
import chinaMapJson from "./china.json"

echarts.registerMap('china', chinaMapJson)

var options = {
  tooltip:{
    show:false
  },
  geo: {
    map: 'china',
    roam:false,
    label: {
        emphasis: {
            show: false
        }
    }
  }
}


const el = document.getElementById("chart")
const chart = echart.init(el)
chart.setOption(options)
import chinaMapJson from "./china.json"

echarts.registerMap('china', chinaMapJson)

var options = {
  tooltip:{
    show:false
  },
  series: [
    {
        type: 'map',
        map: 'china'
    }
  ]
}

const el = document.getElementById("chart")
const chart = echart.init(el)
chart.setOption(options)
如何设置地图的纹理
// 纹理填充
{
  image: imageDom, // 支持为 HTMLImageElement, HTMLCanvasElement,不支持路径字符串
  repeat: 'repeat' // 是否平铺,可以是 'repeat-x', 'repeat-y', 'no-repeat'
}
如何给地图设置阴影
地图阴影其实我使用了geo和series的两种地图叠加起来,第一层geo设置了阴影,第二层series的地图使用了描边。
const imageDom = document.createElement("img")
imageDom.src = "./texture.png"
const lightDom = document.createElement("img")
lightDom.src = "./light.png"

let options = {
  tooltip:{
    show:false
  },
  geo: {
      map: '',
      roam:false,
      label: {
          emphasis: {
              show: false
          }
      },
      itemStyle: {
          shadowColor: '#C3F4F4',
          shadowOffsetX:'-2px',
          shadowOffsetY: '10px',
          shadowBlur: '5px'
      }
  },
  series: [
      {
          type: 'map',
          map: 'china',
          roam: false,
          tooltip:{
            show:false
          },
          label: {
              show:false,
              color:'#fff'
          },
          itemStyle: {
              areaColor:imageDom,
              borderColor: '#C3F4F4',
              borderWidth:'2px'
          },
          emphasis: {
              itemStyle: {
                  areaColor:lightDom
              },
              label:{
                  show:false
              }
          }
      }
  ]
}
地图下钻实现
地图下钻其实就是,在地图的点击事件回调中,加载了另一份地图的json并注册地图,然后再setOption中更改了地图名字。
chart.on('click', (params) => {
    if (params.componentSubType == 'map') {
        goDown(params.name)
    }
})

//用来存放当前的地图名字
let currentName = ''
//用来存放下钻的历史记录
let history = []

async function goDown(name){
    //获取地图数据之后,修改地图options
    const mapname = name
    if (!echarts.getMap(name)) {
        const newMapJson = await getMapJson(name)
        echarts.registerMap(mapname, newMapJson)
    }
    options.geo.map = mapname
    options.series[0].map = mapname
    //然后重新绘制地图
    history.push(currentName)
    chart.setOption(this.options)
    currentName = name
}

async function getMapJson(name) {
  const jsonData = await import('./map/'+name+'.json')
  return jsonData.default
}
地图回钻实现
刚刚在下钻时保存了名字和历史记录,所以回钻就是把历史记录中的最后一项弹出
function returnUpLevel() {
    //先判断history有没有数据,能不能返回
    if(history.length == 0){
        return false
    }
    //取出要返回的那个名字
    const name = history.pop()
    const currentJson = echarts.getMap(mapname).geoJson
    //修改地图配置重新绘制地图
    options.geo.map = mapname
    options.series[0].map = mapname
    chart.setOption(options)
    //修改当前的层级,名字
    currentName = name
}
如何判定点是否在地图中
地图上我打了一些散点,但是在地图下钻后,有一些散点会显示在地图外,所以需要判断哪些点是需要显示的,哪些不要,具体方法我用的射线法,射线法的解释我写在另一篇里了:
射线法判断一个点是否在多边形内部
结合地图json的数据结构,我放一下判断点是否在当前地图中的代码:
function isPointInMaps(p, mapJson) {
const areas = mapJson.features
let flag = false
for(let i = 0;i < areas.length; i++) {
if(rayCasting(p, areas[i].geometry.coordinates[0])) {
flag = true
break
}
}
return flag
}
function rayCasting(p, poly) {
let px = p[0],
py = p[1],
flag = false
for(let i = 0, l = poly.length, j = l - 1; i < l; j = i, i++) {
let sx = poly[i][0],
sy = poly[i][1],
tx = poly[j][0],
ty = poly[j][1]
// 点与多边形顶点重合
if((sx === px && sy === py) || (tx === px && ty === py)) {
return true
}
// 点的射线和多边形的一条边重合,并且点在边上
if((sy === ty && sy === py) && ((sx > px && tx < px) || (sx < px && tx > px))) {
return true
}
// 判断线段两端点是否在射线两侧
if((sy < py && ty >= py) || (sy >= py && ty < py)) {
// 线段上与射线 Y 坐标相同的点的 X 坐标
let x = sx + (py - sy) * (tx - sx) / (ty - sy)
// 点在多边形的边上
if(x === px) {
return true
}
// 射线穿过多边形的边界
if(x > px) {
flag = !flag
}
}
}
// 射线穿过多边形边界的次数为奇数时点在多边形内
return flag ? true : false
}
如何自定义div写的tooltip框
echarts中的tooltip框其实很容易实现,但是我们UI小姐姐设计的。。我短时间内翻echarts配置翻不出来,所以用一个更绝的方法——div来写这个tooltip框,代码我后续会贴,思路是这样的:
- 写一个绝对定位的隐藏起来的div,写好样式
- echarts的散点触发 mouseover 事件的时候,更新div位置,更新其中的数据,并显示div
- echarts的散点触发 mouseout 事件的时候,隐藏div
如何让div写的tooltip框不超出屏幕
因为地图的父元素可能不在页面左上角的位置,所以不能直接用tooltip框的left和top值来计算,所以需要写一个方法来计算元素在页面中的绝对位置:
//获取元素在页面中的绝对位置
export function getElementFixed(element) {
    var actualLeft = element.offsetLeft;
    var actualTop = element.offsetTop;
    var current = element.offsetParent;
    //递归往上把每一级父元素的offsetLeft和offsetTop加起来
    while (current !== null) {
        actualLeft += (current.offsetLeft);
        actualTop += (current.offsetTop);
        current = current.offsetParent;
    }
    return {
        currentX: actualLeft,
        currentY: actualTop
    };
}
得到了绝对位置之后,就可以使用这个位置去计算有没有超出屏幕并进行修正了。
地图下钻组件的设计思路
我打算不仅仅是完成这个两级下钻的功能,将来就算要三级下钻,要从省一级显示,想要配置颜色纹理都可以随心,因此应该封装成一个公共组件,设计思路如下:
echarts地图下钻组件功能
- 可以支持中国,省,市的三级下钻,起点可以是中国,省,终点可以是 中国,省,市
- 可以自定义纹理图,或者颜色以及高亮背景图,高亮颜色
- 可以设置地图边框阴影的颜色以及范围,不传就用默认
- 可以自定义散点图标,或散点图颜色
- 可以自定义散点图的数据
- 可以使用本身的返回按钮,也可以隐藏返回按钮自己调用返回方法
- 可以传自定义的tooltip框的id,也可以不传用默认的
事件:
- 鼠标移入地图区域事件 $emit(‘mapMouseover’)
- 鼠标移出地图区域事件 $emit(‘mapMouseout’)
- 鼠标点击地图区域事件 $emit(‘mapClick’)
- 鼠标移入散点事件 $emit(‘pointMouseover’)
- 鼠标移出散点事件 $emit(‘pointMouseout’)
- 鼠标点击散点事件 $emit(‘pointClick’)
完整代码
<!--
本组件是echarts地图下钻组件
可以支持中国,省,市的三级下钻,起点可以是中国,省,终点可以是 中国,省,市
可以自定义纹理图,或者颜色以及高亮背景图,高亮颜色
可以设置地图边框阴影的颜色以及范围,不传就用默认
可以自定义散点图标,或散点图颜色
可以自定义散点图的数据
可以使用本身的返回按钮,也可以隐藏返回按钮自己调用返回方法
可以传自定义的tooltip框的id,也可以不传用默认的
事件:
鼠标移入地图区域事件 $emit('mapMouseover')
鼠标移出地图区域事件 $emit('mapMouseout')
鼠标点击地图区域事件 $emit('mapClick')
鼠标移入散点事件 $emit('pointMouseover')
鼠标移出散点事件 $emit('pointMouseout')
鼠标点击散点事件 $emit('pointClick')
下钻事件 $emit('goDown')
回钻事件 $emit('goUpside')
-->
<template>
<div class="mapWrapper">
<div class="map" ref="map"></div>
<div class="map-btn" @click="returnUpLevel" v-if="history.length && showReturn">{{history[history.length - 1]}}</div>
</div>
</template>
<script>
import echarts from "echarts"
import {getFontPx,isPointInAreas,getElementFixed} from './map/utils.js'
const level1 = ['中国']
const level2 = ['新疆维吾尔自治区','西藏自治区','内蒙古自治区','青海省','四川省','黑龙江省','甘肃省','云南省','广西壮族自治区','湖南省','陕西省','广东省','吉林省','河北省','湖北省','贵州省','山东省','江西省','河南省','辽宁省','山西省','安徽省','福建省','浙江省','江苏省','重庆市','宁夏回族自治区','海南省','台湾省','北京市','天津市','上海市','香港特别行政区','澳门特别行政区']
export default {
props:{
start:{
type:String,
default:'中国' //也可以是某个省份
},
level:{
type:Number,
default:3 //总共分几级,默认三级:中国、生、市,最高也是3级,多于3级的按3级处理
},
areaColor:{
type:String,
default:'' //如果不用纹理的话可以定义颜色,填写这个参数地图纹理设置就无效
},
areaColorLight:{
type:String,
default:'' //如果不用纹理的话可以定义贴图颜色,填写这个参数地图高亮纹理就无效
},
texture:{
type:String,
default:'/img/mapTexture.png' //地图纹理贴图,可以传图片路径
},
textureLight: {
type:String,
default:'/img/mapTextureLight.png'//地图高亮纹理贴图,可以传图片路径
},
borderColor: {
type:String,
default:'#CAFCFC' //地图边界线颜色
},
shadowColor: {
type:String,
default:'#C3F4F4' //地图阴影颜色
},
tooltip: {
type:String,
default:'' //自定义tooltip框的id,不传就用echarts的tooltip
},
data: {
type:Array,
default() {
return [] //地图上的散点的数据
}
},
effectData: {
type:Array,
default() {
return [] //地图上高亮的散点数据
}
},
tooltipOffset:{
type:Object,
default() {
return {
x:0,
y:'-40px'
}
}
},
pointColor: {
type:String,
default:'' //地图上散点的颜色
},
symbol: {
type:String,
default:'' //地图上散点的图标
},
showReturn: {
type:Boolean,
default: true //是否要显示返回按钮。。如果隐藏的话可以自己在外面定义隐藏按钮
}
},
data() {
return {
chart:null, //echarts图表
options:{}, //echarts的options
history:[], //下钻过程中记录历史,方便返回
currentLevel:1, // 目前所在层级
startLevel:1, // 起始的level
endLevel:3, // 结束的level
currentName:'',//当前的地图名字
currentJson:null, //当前的json
lastHoverParams:'',//上一个高亮的元素
}
},
mounted() {
this.init()
},
beforeDestroy() {
if(this.chart){
this.chart.dispose()
}
window.removeEventListener('resize', this.resize, false)
},
watch:{
start(newVal){
this.resolveStart()
this.drawChart()
},
level(newVal){
this.resolveLevel()
this.drawChart()
},
areaColor(newVal){
this.resolveTexture()
this.drawChart()
},
areaColorLight(){
this.resolveTextureLight()
this.drawChart()
},
texture(newVal){
this.resolveTexture()
this.drawChart()
},
textureLight(newVal){
this.resolveTextureLight()
this.drawChart()
},
borderColor(newVal) {
this.resolveBorderColor()
this.drawChart()
},
shadowColor(newVal) {
this.resolveShadowColor()
this.drawChart()
},
tooltip(newVal) {
this.resolveTooltip()
this.drawChart()
},
data(newVal) {
this.resolveData()
this.drawChart()
},
pointColor(newVal) {
this.resolveSymbol()
this.drawChart()
},
symbol(newVal) {
this.resolveSymbol()
this.drawChart()
}
},
methods:{
//解析start参数
resolveStart() {
//先解析start是几级
if(level1.indexOf(this.start) > -1) {
this.startLevel = 1
}else if(level2.indexOf(this.start) > -1){
this.startLevel = 2
}else{
this.startLevel = 1
}
this.currentName = this.start
this.currentLevel = this.startLevel
const mapname = this.currentName == '中国'?'china':this.currentName
this.options.geo.map = mapname
this.options.series[0].map = mapname
},
//解析level参数
resolveLevel() {
this.endLevel = this.startLevel + this.level - 1
if(this.endLevel > 3) {
this.endLevel = 3
}
if(this.endLevel < 1) {
this.endLevel = 1
}
},
//解析颜色或纹理
resolveTexture() {
if(this.areaColor){
this.options.series[0].itemStyle.areaColor = this.areaColor
}else{
const imageDom = document.createElement("img")
imageDom.src = this.texture
this.options.series[0].itemStyle.areaColor = {
image: imageDom, // 支持为 HTMLImageElement, HTMLCanvasElement,不支持路径字符串
repeat: 'repeat' // 是否平铺,可以是 'repeat-x', 'repeat-y', 'no-repeat'
}
}
},
//解析高亮颜色或纹理
resolveTextureLight() {
if(this.areaColorLight){
this.options.series[0].emphasis.itemStyle.areaColor = this.areaColor
}else{
const imageDomLight = document.createElement("img")
imageDomLight.src = this.textureLight
this.options.series[0].emphasis.itemStyle.areaColor = {
image: imageDomLight, // 支持为 HTMLImageElement, HTMLCanvasElement,不支持路径字符串
repeat: 'repeat' // 是否平铺,可以是 'repeat-x', 'repeat-y', 'no-repeat'
}
}
},
//解析borderColor
resolveBorderColor() {
this.options.series[0].itemStyle.borderColor = this.borderColor
},
//解析shadowColor
resolveShadowColor() {
this.options.geo.itemStyle.shadowColor = this.shadowColor
},
resolveSymbol() {
if(this.pointColor) {
this.options.series[1].itemStyle = {
color:this.pointColor
}
}
if(this.symbol) {
this.options.series[1].symbol = this.symbol
}
},
//解析tooltip
resolveTooltip() {
if(!this.tooltip) {
this.options.tooltip.show = true
}else{
this.options.tooltip.show = false
}
},
//解析data
resolveData() {
if(this.data && this.data.length > 0) {
this.options.series[1].data = this.data
}
if(this.effectData && this.effectData.length > 0) {
this.options.series[2].data = this.effectData
}
},
initOptions() {
this.options = {
tooltip:{
show:false
},
geo: {
map: '',
roam:false,
label: {
emphasis: {
show: false
}
},
itemStyle: {
shadowColor: '',
shadowOffsetX: '-2px',
shadowOffsetY: '10px',
shadowBlur: '5px'
}
},
series: [
{
type: 'map',
map: '',
roam: false,
tooltip:{
show:false
},
label: {
show:false,
color:'#fff'
},
itemStyle: {
areaColor:'',
borderColor: '',
borderWidth:'2px'
},
emphasis: {
itemStyle: {
areaColor:''
},
label:{
show:false
}
}
},
{
type:'scatter',
coordinateSystem: 'geo',
data: [],
symbol:'',
},
{
type: 'effectScatter',
coordinateSystem: 'geo',
data: [],
showEffectOn: 'render',
rippleEffect: {
number:1,
scale:3,
brushType: 'fill'
},
emphasis: {
scale: true
},
}
]
}
},
//初始化
init() {
this.initOptions()
this.resolveStart()
this.resolveLevel()
this.resolveTexture()
this.resolveTextureLight()
this.resolveBorderColor()
this.resolveShadowColor()
this.resolveSymbol()
this.resolveTooltip()
this.resolveData()
this.drawChart()
},
async drawChart() {
if(this.chart) {
this.chart.setOption(this.options);
}else {
const el = this.$refs.map
const mapname = this.currentName=='中国'?'china':this.currentName
if (!echarts.getMap(mapname)) {
const mapJson = await this.getMapJson(this.currentName, this.currentLevel)
echarts.registerMap(mapname, mapJson)
this.currentJson = mapJson
}
const currentData = this.data.filter(item => {
return isPointInAreas([item.value[0],item.value[1]], this.currentJson)
})
this.options.series[1].data = currentData
const currentEffectData = this.effectData.filter(item => {
return isPointInAreas([item.value[0],item.value[1]], this.currentJson)
})
this.options.series[2].data = currentEffectData
this.chart = echarts.init(el);
this.chart.setOption(this.options);
window.addEventListener('resize', this.resize, false)
//绑定各种事件
this.chart.on('click', (params) => {
if (params.componentSubType == 'map') {
this.$emit('mapClick', params)
this.goDown(params.name)
} else if (params.componentSubType == 'scatter' || params.componentSubType == 'effectScatter') {
console.log(params.componentSubType,"click")
this.$emit('pointClick', params)
}
})
this.chart.on('mouseover',(params) => {
if (params.componentSubType == 'map') {
this.$emit('mapMouseover', params)
if(this.lastHoverParams.componentSubType == 'effectScatter') {
this.$emit('pointMouseout', this.lastHoverParams)
const tooltip = document.getElementById(this.tooltip)
tooltip.style.display = 'none'
}
} else if (params.componentSubType == 'scatter' || params.componentSubType == 'effectScatter') {
if(params.componentSubType == 'scatter' && this.lastHoverParams.componentSubType == 'effectScatter') {
this.$emit('pointMouseout', this.lastHoverParams)
const tooltip = document.getElementById(this.tooltip)
tooltip.style.display = 'none'
}
this.$emit('pointMouseover', params)
const tooltip = document.getElementById(this.tooltip)
tooltip.style.display = 'block'
const width = tooltip.clientWidth
const height = tooltip.clientHeight
let x = params.event.offsetX - width / 2
let y = params.event.offsetY - height + this.tooltipOffset.y
tooltip.style.top = y + 'px'
tooltip.style.left = x + 'px'
const fixedPosition = getElementFixed(tooltip)
const windowWidth = document.body.clientWidth
//判断上方有没有小于0,如果小于0,就让框放到下面去
if(fixedPosition.currentY < 0) {
let y = params.event.offsetY - this.tooltipOffset.y
tooltip.style.top = y + 'px'
}
//判断左边有没有小于0,如果小于0,就让框放到右边去
if(fixedPosition.currentX < 0) {
let x = params.event.offsetX - width / 2 - fixedPosition.currentX
tooltip.style.left = x + 'px'
}
//判断右边有没有小于0,如果小于0,就让框放到左边去
if((fixedPosition.currentX + width) > windowWidth) {
let x = params.event.offsetX - width / 2 - (fixedPosition.currentX + width - windowWidth)
tooltip.style.left = x + 'px'
}
}
this.lastHoverParams = params
})
this.chart.on('mouseout',(params) => {
if(params.componentSubType == 'scatter') {
if (params.componentSubType == 'map') {
this.$emit('mapMouseout', params)
} else if (params.componentSubType == 'scatter' || params.componentSubType == 'effectScatter') {
this.$emit('pointMouseout', params)
const tooltip = document.getElementById(this.tooltip)
tooltip.style.display = 'none'
}
}
})
}
},
async getMapJson(name,level) {
if(level == 1 || level == 2) {
const jsonData = await import('./map/'+name+'.json')
return jsonData.default
}else if(level == 3) {
const jsons = this.currentJson.features.filter(item => item.properties.name == name)
const mapJson = {
"type": "FeatureCollection",
"features": jsons
}
return mapJson
}
},
//下钻
async goDown(name){
//先判断可不可以下钻
if(this.currentLevel > 2){
return false
}
if(this.currentLevel == this.endLevel) {
return false
}
//判断下钻的是几级
const goDownLevel = this.currentLevel + 1
//获取地图数据之后,修改地图options
const mapname = name=='中国'?'china':name
if (!echarts.getMap(name)) {
const newMapJson = await this.getMapJson(name,goDownLevel)
echarts.registerMap(mapname, newMapJson)
this.currentJson = newMapJson
}else{
this.currentJson = echarts.getMap(mapname).geoJson
}
this.options.geo.map = mapname
this.options.series[0].map = mapname
const currentData = this.data.filter(item => {
return isPointInAreas([item.value[0],item.value[1]], this.currentJson)
})
this.options.series[1].data = currentData
const currentEffectData = this.effectData.filter(item => {
return isPointInAreas([item.value[0],item.value[1]], this.currentJson)
})
this.options.series[2].data = currentEffectData
//然后重新绘制地图
this.history.push(this.currentName)
this.chart.setOption(this.options)
this.currentName = name
this.currentLevel += 1
this.$emit('goDown',{
name:this.currentName,
level:this.currentLevel,
json:this.currentJson
})
},
//返回上级
returnUpLevel() {
//先判断history有没有数据,能不能返回
if(this.history.length == 0){
return false
}
//取出要返回的那个名字
const name = this.history.pop()
const mapname = name=='中国'?'china':name
this.currentJson = echarts.getMap(mapname).geoJson
//修改地图配置重新绘制地图
this.options.geo.map = mapname
this.options.series[0].map = mapname
const currentData = this.data.filter(item => {
return isPointInAreas([item.value[0],item.value[1]], this.currentJson)
})
this.options.series[1].data = currentData
const currentEffectData = this.effectData.filter(item => {
return isPointInAreas([item.value[0],item.value[1]], this.currentJson)
})
this.options.series[2].data = currentEffectData
this.chart.setOption(this.options)
//修改当前的层级,名字,还有currentJson
this.currentName = name
this.currentLevel -= 1
this.$emit('goUpside',{
name:this.currentName,
level:this.currentLevel,
json:this.currentJson
})
},
resize () {
window.setTimeout(() => {
if(this.chart) {
this.chart.resize()
}
}, 100)
},
}
}
</script>
<style lang="scss" scoped>
.mapWrapper {
width:100%;
height:100%;
position: relative;
}
.map {
width:100%;
height:100%;
}
.map-btn {
background: #132F56;
font-size:0.72rem;
color:#fff;
cursor: pointer;
display: inline-block;
padding:0.5em 1.5em;
position:absolute;
left:1%;
top:2%;
border:1px solid #163F67;
}
</style>
// util.js
// 射线判断函数
export function rayCasting(p, poly) {
    let px = p[0],
        py = p[1],
        flag = false

    for(let i = 0, l = poly.length, j = l - 1; i < l; j = i, i++) {
        let sx = poly[i][0],
            sy = poly[i][1],
            tx = poly[j][0],
            ty = poly[j][1]

        // 点与多边形顶点重合
        if((sx === px && sy === py) || (tx === px && ty === py)) {
            return true
        }

        // 点的射线和多边形的一条边重合,并且点在边上
        if((sy === ty && sy === py) && ((sx > px && tx < px) || (sx < px && tx > px))) {
            return true
        }

        // 判断线段两端点是否在射线两侧
        if((sy < py && ty >= py) || (sy >= py && ty < py)) {
            // 线段上与射线 Y 坐标相同的点的 X 坐标
            let x = sx + (py - sy) * (tx - sx) / (ty - sy)

            // 点在多边形的边上
            if(x === px) {
                return true
            }

            // 射线穿过多边形的边界
            if(x > px) {
                flag = !flag
            }
        }
    }

    // 射线穿过多边形边界的次数为奇数时点在多边形内
    return flag ? true : false
}

//判断点有没有在某个行政区
export function isPointInAreas(p, mapJson) {
    const areas = mapJson.features
    let flag = false
    for(let i = 0;i < areas.length; i++) {
        if(rayCasting(p, areas[i].geometry.coordinates[0])) {
            flag = true
            break
        }
    }
    return flag
}

//获取元素在页面中的绝对位置
export function getElementFixed(element) {
    var actualLeft = element.offsetLeft;
    var actualTop = element.offsetTop;
    var current = element.offsetParent;
    while (current !== null) {
        actualLeft += (current.offsetLeft);
        actualTop += (current.offsetTop);
        current = current.offsetParent;
    }
    return {
        currentX: actualLeft,
        currentY: actualTop
    };
}
好了,接下来我打算研究研究怎么把echarts地图的效果写得炫酷一点(如果有时间的话,诶嘿~我现在不就是有时间吗?写完这篇就开始研究)
原文地址:https://blog.csdn.net/qq_23447231/article/details/121928744
本文来自互联网用户投稿,该文观点仅代表作者本人,不代表本站立场。本站仅提供信息存储空间服务,不拥有所有权,不承担相关法律责任。
如若转载,请注明出处:http://www.7code.cn/show_12871.html
如若内容造成侵权/违法违规/事实不符,请联系代码007邮箱:suwngjj01@126.com进行投诉反馈,一经查实,立即删除!


