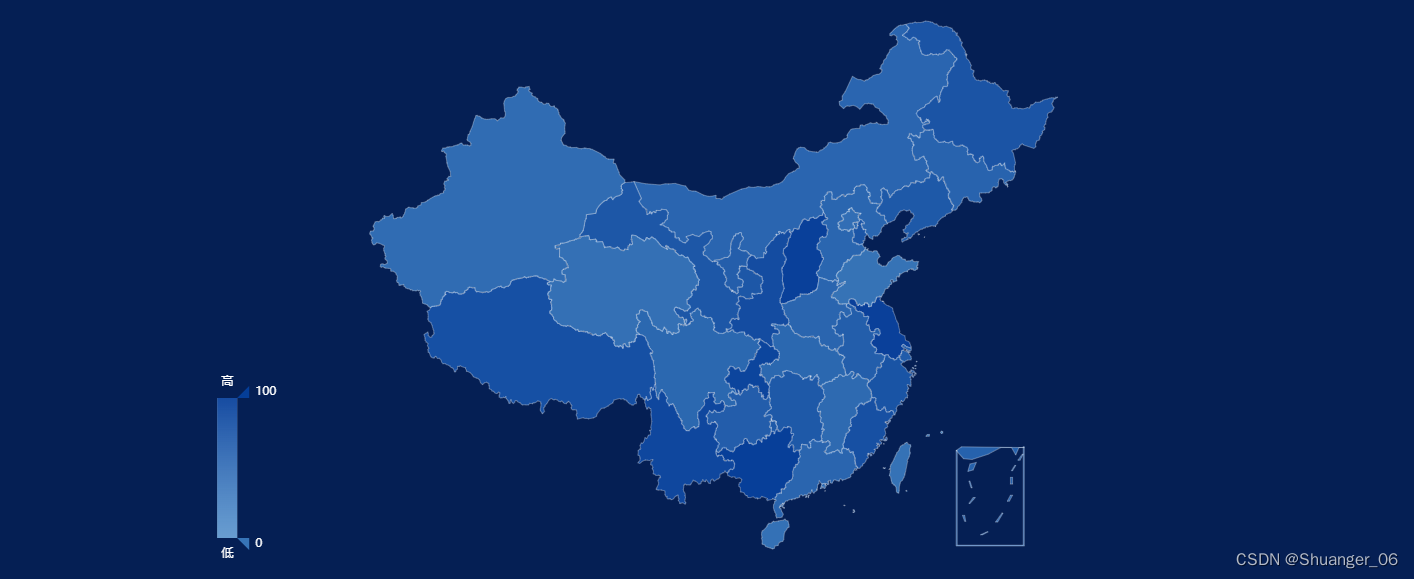
中国地图
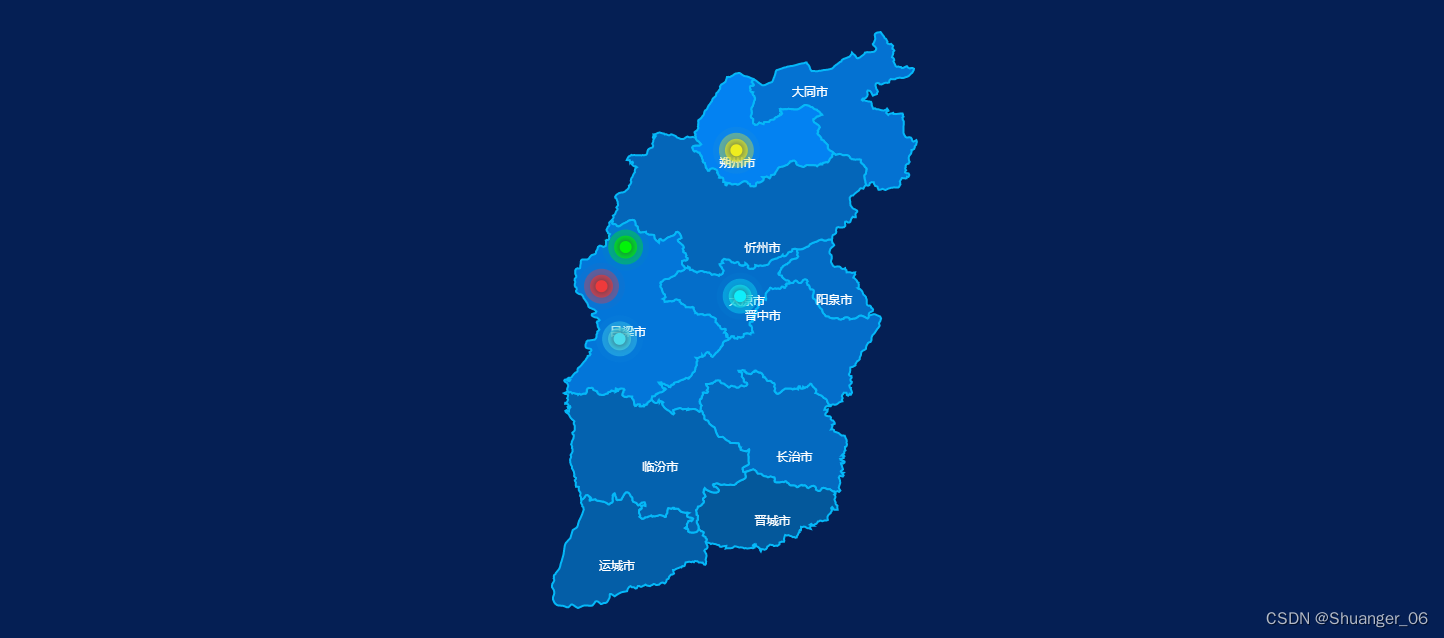
山西地图
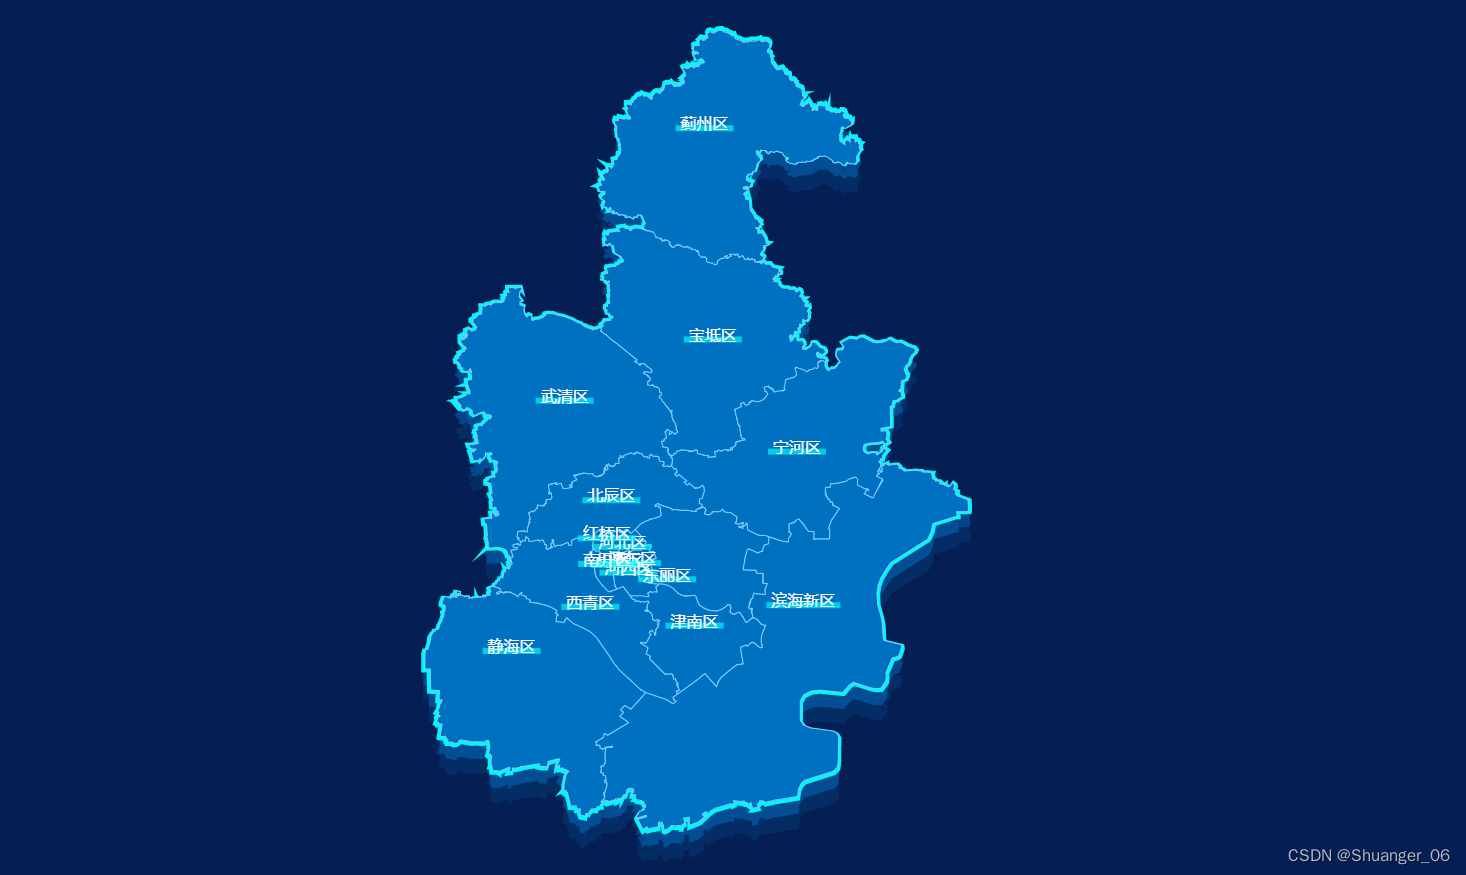
天津地图(实现3D立体效果)
地图赋值
initMapChart() {
	let mapData = [{
		name: '北京',
		value: this.randomData()
	}, {
		name: '天津',
		value: this.randomData()
	}, {
		name: '上海',
		value: this.randomData()
	}, {
		name: '重庆',
		value: this.randomData()
	}, {
		name: '河北',
		value: this.randomData()
	}, {
		name: '河南',
		value: this.randomData()
	}, {
		name: '云南',
		value: this.randomData()
	}, {
		name: '辽宁',
		value: this.randomData()
	}, {
		name: '黑龙江',
		value: this.randomData()
	}, {
		name: '湖南',
		value: this.randomData()
	}, {
		name: '安徽',
		value: this.randomData()
	}, {
		name: '山东',
		value: this.randomData()
	}, {
		name: '新疆',
		value: this.randomData()
	}, {
		name: '江苏',
		value: this.randomData()
	}, {
		name: '浙江',
		value: this.randomData()
	}, {
		name: '江西',
		value: this.randomData()
	}, {
		name: '湖北',
		value: this.randomData()
	}, {
		name: '广西',
		value: this.randomData()
	}, {
		name: '甘肃',
		value: this.randomData()
	}, {
		name: '山西',
		value: this.randomData()
	}, {
		name: '内蒙古',
		value: this.randomData()
	}, {
		name: '陕西',
		value: this.randomData()
	}, {
		name: '吉林',
		value: this.randomData()
	}, {
		name: '福建',
		value: this.randomData()
	}, {
		name: '贵州',
		value: this.randomData()
	}, {
		name: '广东',
		value: this.randomData()
	}, {
		name: '青海',
		value: this.randomData()
	}, {
		name: '西藏',
		value: this.randomData()
	}, {
		name: '四川',
		value: this.randomData()
	}, {
		name: '宁夏',
		value: this.randomData()
	}, {
		name: '海南',
		value: this.randomData()
	}, {
		name: '台湾',
		value: this.randomData()
	}, {
		name: '香港',
		value: this.randomData()
	}, {
		name: '澳门',
		value: this.randomData()
	}, {
		name: '南海诸岛',
		value: this.randomData()
	}];
	basicMapChart(this.$Echarts.init(document.getElementById('map1')), mapData);

	let provinceData1 = [{
		name: '大同市',
		value: this.randomData()
	}, {
		name: '朔州市',
		value: this.randomData()
	}, {
		name: '忻州市',
		value: this.randomData()
	}, {
		name: '吕梁市',
		value: this.randomData()
	}, {
		name: '太原市',
		value: this.randomData()
	}, {
		name: '阳泉市',
		value: this.randomData()
	}, {
		name: '晋中市',
		value: this.randomData()
	}, {
		name: '临汾市',
		value: this.randomData()
	}, {
		name: '长治市',
		value: this.randomData()
	}, {
		name: '晋城市',
		value: this.randomData()
	}, {
		name: '运城市',
		value: this.randomData()
	}];
	sxMapChart(this.$Echarts.init(document.getElementById('map2')), provinceData1);

	let provinceData2 = [{
		name: '蓟州区',
		value: this.randomData()
	}, {
		name: '宝坻区',
		value: this.randomData()
	}, {
		name: '武清区',
		value: this.randomData()
	}, {
		name: '宁河区',
		value: this.randomData()
	}, {
		name: '北辰区',
		value: this.randomData()
	}, {
		name: '西青区',
		value: this.randomData()
	}, {
		name: '东丽区',
		value: this.randomData()
	}, {
		name: '滨海新区',
		value: this.randomData()
	}, {
		name: '静海区',
		value: this.randomData()
	}, {
		name: '津南区',
		value: this.randomData()
	}, {
		name: '河北区',
		value: this.randomData()
	}, {
		name: '河东区',
		value: this.randomData()
	}, {
		name: '河西区',
		value: this.randomData()
	}, {
		name: '南开区',
		value: this.randomData()
	}, {
		name: '和平区',
		value: this.randomData()
	}, {
		name: '红桥区',
		value: this.randomData()
	}];
	this.mapChart = this.$Echarts.init(document.getElementById('map3'));
	tjMapChart(this.mapChart, provinceData2);

	let shadowChart = this.$Echarts.init(document.getElementById('shadowMap'));
	shadowMapChart(shadowChart);// 地图阴影效果
},
randomData() {
	return Math.round(Math.random() * 100);
}
import 'echarts/map/js/china';// 引入插件自带地图js-中国地图数据
import 'echarts/map/js/province/shanxi';// 引入插件自带地图js-山西地图数据
import 'echarts/map/js/province/tianjin';// 引入插件自带地图js-天津地图数据
let colorArr = ['#EFED1E', '#01F408', '#EE3A3B', '#4ADBEC', '#0FEEFB'];

/**
 * 基础地图
 * @param 	chart:echart容器
 * 			chartData: 图表数据
 */
export function basicMapChart(chart, chartData) {
	let option = {
		tooltip: {
			formatter: function(e) {
				var name = e.name ? e.name : '获取中';
				var value = e.value ? e.value : '暂无数据'
				return name + ":" + value;
			}
		},
		visualMap: {
			min: 0,
			max: 100,
			left: '20%',
			bottom: 20,
			text: ['高', '低'],
			calculable: true,
			textStyle: {
				color: '#fff'
			},
			inRange: {
				color: ['rgba(77,152,225,.7)', 'rgba(6,65,160,.9)']
			}
		},
		geo: {
			map: 'china',
			roam: false,
			zoom: 1.1,
			label: {
				emphasis: {
					show: false
				}
			},
			itemStyle: {
				borderColor: 'transparent',
				areaColor: 'transparent'
			}
		},
		series: [{
			type: 'map',
			map: 'china',
			zoom: 1.1,
			itemStyle: {
				borderWidth: 1,
				borderColor: 'rgba(255,255,255,.3)',
				emphasis: {
					borderColor: '#40C9EA',
					shadowColor: 'rgba(3,221,255,0.4)',
	            	shadowBlur: 15,
					label: {
						color: '#fff'
					},
					areaColor: {
						x: 0,
						y: 0,
						x2: 0,
						y2: 1,
						colorStops: [{
							offset: 0,
							color: '#0F58BF'
						}, {
							offset: 1,
							color: '#084095'
						}],
					},
				}
			},
			data: chartData
		}]
	};
	chart.setOption(option);
}


/**
 * 山西地图
 * @param 	chart:echart容器
 * 			chartData: 图表数据
 */
export function sxMapChart(chart, chartData, flag) {
	let option = {
		tooltip: {
			formatter: function(e) {
				var name = e.name ? e.name : '获取中';
				var value = e.value ? e.value : '暂无数据'
				return name + ":" + value;
			}
		},
		visualMap: {
			show: false,
			min: 0,
			max: 100,
			inRange: {
				color: ['#0388FF', '#053859']
			}
		},
		geo: {
			map: '山西',
			roam: false,
			zoom: 1.2,
			aspectScale: 0.9,
			label: {
				emphasis: {
					show: false
				}
			},
			itemStyle: {
				borderColor: 'transparent',
				areaColor: 'transparent'
			}
		},
		series: [{
			type: 'map',
			map: '山西',
			zoom: 1.2,
			aspectScale: 0.9,
			label: {
				show: true,
				color: '#fff',
			},
			itemStyle: {
				borderWidth: 2,
				borderColor: '#05B8F8',
				emphasis: {
					borderColor: '#5EBADB',
					label: {
						color: '#fff'
					},
					areaColor: '#B4917F'
				}
			},
			data: chartData
		}, {
			type: 'effectScatter',
            coordinateSystem: 'geo',
            showEffectOn: 'render',
            zlevel: 2,
            rippleEffect: {
                period: 15,
                scale: 4,
                brushType: 'fill'
            },
            hoverAnimation: true,
            label: {
                normal: {
                    show: false
                },
            },
            itemStyle: {
                normal: {
                	color: (param) => {
	                    return colorArr[param.dataIndex];
	                },
                    shadowBlur: 10,
                    shadowColor: '#333'
                }
            },
            symbolSize: 12,
            data: [{
		    	name: 'a',
		    	visualMap: false,
			    value: [112.42227451275963, 39.47420453623572],
			}, {
			    name: 'b',
			    visualMap: false,
			    value: [111.106869792807, 38.43977743019218]
			}, {
			    name: 'c',
			    visualMap: false,
			    value: [110.82052318710302, 38.02144293877752]
			}, {
			    name: 'd',
			    visualMap: false,
			    value: [111.035283141381, 37.45859289578324]
			}, {
			    name: 'e',
			    visualMap: false,
			    value: [112.46701616990087, 37.91495779550833]
			}]
		}]
	};
	chart.setOption(option);
	// 图表点击事件
	chart.on('click', function (param) {
		// 地图当前点击经纬度
        console.log(chart.convertFromPixel('geo', [param.event.offsetX, param.event.offsetY]));
    });
}


/**
 * 天津地图
 * @param 	chart:echart容器
 * 			chartData: 图表数据
 */
export function tjMapChart(chart, chartData) {
	let option = {
		tooltip: {
			formatter: function(e) {
				var name = e.name ? e.name : '获取中';
				var value = e.value ? e.value : '暂无数据'
				return name + ":" + value;
			}
		},
		geo: {// 底层地图
			map: '天津',
			roam: false,
			aspectScale: 0.85,
			layoutCenter: ["46%", "52%"],
			layoutSize: '80.5%',
			label: {
				emphasis: {
					show: false
				}
			},
			itemStyle: {
				borderWidth: 4,
				shadowColor: 'red',
				borderColor: '#00f6fb',
				areaColor: 'transparent',
			}
		},
		series: [{// 顶层地图
			type: 'map',
			map: '天津',
			roam: false,
			aspectScale: 0.85,
			layoutCenter: ["46%", "52%"],
			layoutSize: '80%',
			label: {
				show: true,
				color: '#fff',
				formatter: function(param) {
					return '{a|' + param.name + '}';
				},
				rich: {
					a: {
						height: 0,
						fontSize: 16,
						padding: [6,5,0,5],
						backgroundColor: 'rgba(0,243,248,.7)',
					}
				}
			},
			itemStyle: {
				borderWidth: 1,
				borderColor: '#7dcdff',
				areaColor: '#0071c0',
				emphasis: {
					borderColor: '#7dcdff',
					label: {
						color: '#fff'
					},
				}
			},
			data: chartData
		},
//		{
//			type: 'scatter',
//          coordinateSystem: 'geo',
//          symbol: 'pin',
//          symbolSize: [50,50],
//          showEffectOn: 'render',
//          zlevel: 2,
//          hoverAnimation: true,
//          rippleEffect: {
//				brushType: 'stroke'
//          },
//          label: {
//              normal: {
//					show: true,
//                  textStyle: {
//                      color: '#fff',
//                      fontSize: 9,
//                  },
//                  formatter (value){
//                      return 100;
//                  }
//              },
//          },
//          itemStyle: {
//              normal: {
//              	color: '#01F408',
//                  shadowBlur: 10,
//                  shadowColor: '#333'
//              }
//          },
//          data: [{
//		    	name: 'a',
//		    	visualMap: false,
//			    value: [117.43499282770108, 39.52057432893366],
//			}, {
//			    name: 'b',
//			    visualMap: false,
//			    value: [117.57121546620637, 39.31794316585672]
//			}, {
//			    name: 'c',
//			    visualMap: false,
//			    value: [116.98470132819752, 38.85156985401295]
//			}]
//		}
		]
	};
	chart.setOption(option);
	// 图表点击事件
	chart.on('click', function (param) {
		// 地图当前点击经纬度
        console.log(chart.convertFromPixel('geo', [param.event.offsetX, param.event.offsetY]));
    });
}

export function shadowMapChart(chart) {
	let option = {
		geo: {// 底层地图
			map: '天津',
			roam: false,
			aspectScale: 0.85,
			layoutCenter: ["46%", "53.5%"],
			layoutSize: '80.5%',
			label: {
				show: false
			},
			itemStyle: {
				borderColor: 'transparent',
				areaColor: 'rgba(0,156,255,.3)',
			}
		},
		series: [{// 顶层地图
			type: 'map',
			map: '天津',
			roam: false,
			aspectScale: 0.85,
			layoutCenter: ["46%", "55%"],
			layoutSize: '80.5%',
			label: {
				show: false,
			},
			itemStyle: {
				borderColor: 'transparent',
				areaColor: 'rgba(0,156,255,.1)',
				emphasis: {
					show: false
				}
			},
		}]
	};
	chart.setOption(option);
}
原文地址:https://blog.csdn.net/weixin_44389116/article/details/131598644
本文来自互联网用户投稿,该文观点仅代表作者本人,不代表本站立场。本站仅提供信息存储空间服务,不拥有所有权,不承担相关法律责任。
如若转载,请注明出处:http://www.7code.cn/show_14951.html
如若内容造成侵权/违法违规/事实不符,请联系代码007邮箱:suwngjj01@126.com进行投诉反馈,一经查实,立即删除!
声明:本站所有文章,如无特殊说明或标注,均为本站原创发布。任何个人或组织,在未征得本站同意时,禁止复制、盗用、采集、发布本站内容到任何网站、书籍等各类媒体平台。如若本站内容侵犯了原著者的合法权益,可联系我们进行处理。

