01、Tensorflow实现二元手写数字识别(二分类问题)
01、Tensorflow实现二元手写数字识别(二分类问题)
02、Tensorflow实现手写数字识别(数字0-9)
开始学习机器学习啦,已经把吴恩达的课全部刷完了,现在开始熟悉一下复现代码。对这个手写数字实部比较感兴趣,作为入门的素材非常合适。
1、识别目标
识别手写仅仅是为了区分手写的0和1,所以实际上是一个二分类问题。
2、Tensorflow算法实现
import numpy as np
import tensorflow as tf
from keras.models import Sequential
from keras.layers import Dense
from sklearn.model_selection import train_test_split
import matplotlib.pyplot as plt
import warnings
import logging
from sklearn.metrics import accuracy_score
import numpy as np:这是引入numpy库,并为其设置一个缩写np。Numpy是Python中用于大规模数值计算的库,它提供了多维数组对象及一系列操作这些数组的函数。
import tensorflow as tf:这是引入tensorflow库,并为其设置一个缩写tf。TensorFlow是一个开源的深度学习框架,它被广泛用于各种深度学习应用。
from keras.models import Sequential:这是从Keras库中引入Sequential模型。Keras是一个高级神经网络API,它可以运行在TensorFlow之上。Sequential模型是Keras中的线性堆栈模型,允许你简单地堆叠多个网络层。
from keras.layers import Dense:这是从Keras库中引入Dense层。Dense层是神经网络中的全连接层,每个输入节点与输出节点都是连接的。
from sklearn.model_selection import train_test_split:这是从scikit-learn库中引入train_test_split函数。这个函数用于将数据分割为训练集和测试集。
import matplotlib.pyplot as plt:这是引入matplotlib的pyplot模块,并为其设置一个缩写plt。Matplotlib是Python中的绘图库,而pyplot是其中的一个模块,用于绘制各种图形和图像。
from sklearn.metrics import accuracy_score:这是从scikit-learn库中引入accuracy_score函数。这个函数用于计算分类准确率,常用于评估分类模型的性能。
logging.getLogger("tensorflow").setLevel(logging.ERROR)
tf.autograph.set_verbosity(0)
warnings.simplefilter(action='ignore', category=FutureWarning)
# 支持中文显示
plt.rcParams['font.sans-serif']=['SimHei']
plt.rcParams['axes.unicode_minus']=False
logging.getLogger(“tensorflow”).setLevel(logging.ERROR):这行代码用于设置 TensorFlow 的日志级别为 ERROR。这意味着只有当 TensorFlow 中发生错误时,才会在日志中输出相关信息。较低级别的日志信息(如 WARNING、INFO、DEBUG)将被忽略。
tf.autograph.set_verbosity(0):这行代码用于设置 TensorFlow 的自动图形(Autograph)日志的冗长级别为 0。这意味着在将 Python 代码转换为 TensorFlow 图形代码时,将不会输出任何日志信息。这有助于减少日志噪音,使日志更加干净。
warnings.simplefilter(action=‘ignore’,category=FutureWarning):这行代码用于忽略所有 FutureWarning 类型的警告。在 Python中,当使用某些即将过时或未来版本中可能发生变化的特性时,通常会发出 FutureWarning。通过设置action=‘ignore’,代码将不会输出这类警告,使控制台输出更加干净。
plt.rcParams[‘font.sans-serif’]=[‘SimHei’]:这行代码用于设置 matplotlib 中的默认无衬线字体为 SimHei。SimHei 是一种常用于显示中文的字体,这样设置后,matplotlib 将在绘图时使用 SimHei 字体来显示中文,从而避免中文乱码问题。
plt.rcParams[‘axes.unicode_minus’]=False:这行代码用于解决 matplotlib
中负号显示异常的问题。默认情况下,matplotlib 可能无法正确显示负号,将其设置为 False 可以使用 ASCII字符作为负号,从而正常显示。
X, y = load_data()
print('The shape of X is: ' + str(X.shape))
print('The shape of y is: ' + str(y.shape))
X_train, X_test, y_train, y_test = train_test_split(X, y, test_size=0.1, random_state=42)
# 构建模型,三层模型进行分类,第一层输入100个神经元...
model = Sequential(
    [
        tf.keras.Input(shape=(400,)),    #specify input size
        ### START CODE HERE ###
        Dense(100, activation='sigmoid'),
        Dense(10, activation='sigmoid'),
        Dense(1, activation='sigmoid')
        ### END CODE HERE ###
    ], name = "my_model"
)
# 打印三层模型的参数
model.summary()
# 模型设定,学习率0.001,因为是分类,使用BinaryCrossentropy损失函数
model.compile(
    loss=tf.keras.losses.BinaryCrossentropy(),
    optimizer=tf.keras.optimizers.Adam(0.001),
)
# 开始训练,训练循环20
model.fit(
    X_train,y_train,
    epochs=20
)
STEP5:结果可视化与打印准确度信息
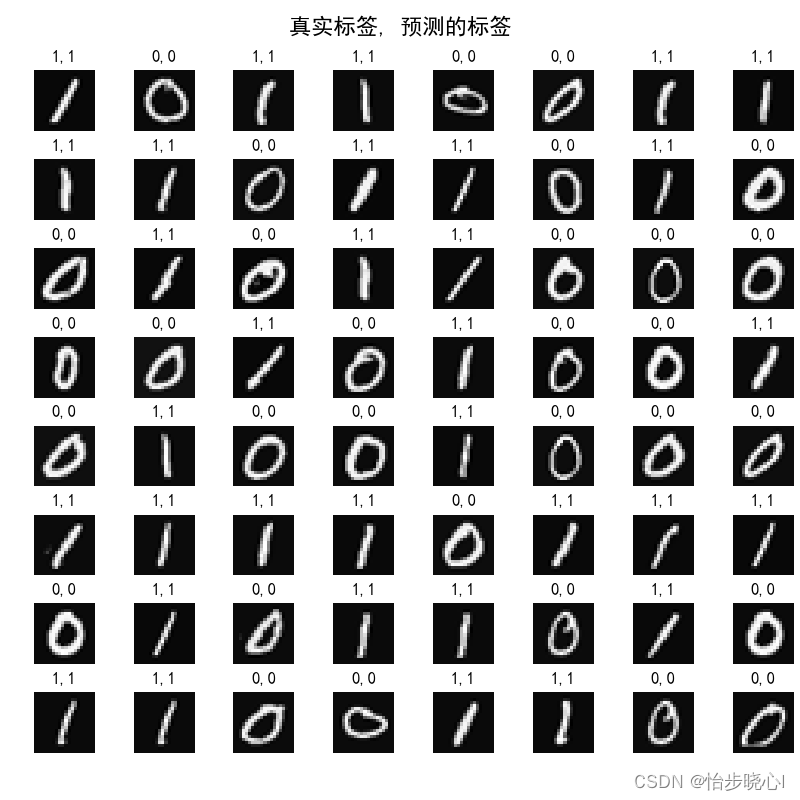
原始的输入的数据集是400 * 1000的数组,共包含1000个手写数字的数据,其中400为20*20像素的图片,因此对每个400的数组进行reshape((20, 20))可以得到原始的图片进而绘图。
# 绘制测试集的预测结果,绘制64个
fig, axes = plt.subplots(8, 8, figsize=(8, 8))
fig.tight_layout(pad=0.1, rect=[0, 0.03, 1, 0.92])  # [left, bottom, right, top]
for i, ax in enumerate(axes.flat):
    # Select random indices
    random_index = np.random.randint(X_test.shape[0])

    # Select rows corresponding to the random indices and
    # reshape the image
    X_random_reshaped = X_test[random_index].reshape((20, 20)).T

    # Display the image
    ax.imshow(X_random_reshaped, cmap='gray')

    # Predict using the Neural Network
    prediction = model.predict(X_test[random_index].reshape(1, 400))
    if prediction >= 0.5:
        yhat = 1
    else:
        yhat = 0
    # Display the label above the image
    ax.set_title(f"{y_test[random_index, 0]},{yhat}")
    ax.set_axis_off()
fig.suptitle("真实标签, 预测的标签", fontsize=16)
plt.show()

# 给出预测的测试集误差
y_pred=model.predict(X_test)
print("测试数据集准确率为:", accuracy_score(y_test, np.round(y_pred)))
3、运行结果
按照最初的划分,数据集包含1000个数据,划分10%为测试集,也就是100个数据。结果可视化随机选择其中的64个数据绘图,每个图像的上方标明了其真实标签和预测的结果,这个是一个非常简单的示例,准确度还是非常高的。


4、工程下载与全部代码
工程链接:Tensorflow实现二元手写数字识别(二分类问题)
import numpy as np
import tensorflow as tf
from keras.models import Sequential
from keras.layers import Dense
from sklearn.model_selection import train_test_split
import matplotlib.pyplot as plt
import warnings
import logging
from sklearn.metrics import accuracy_score

logging.getLogger("tensorflow").setLevel(logging.ERROR)
tf.autograph.set_verbosity(0)
warnings.simplefilter(action='ignore', category=FutureWarning)
# 支持中文显示
plt.rcParams['font.sans-serif']=['SimHei']
plt.rcParams['axes.unicode_minus']=False

# load dataset
def load_data():
    X = np.load("Handwritten_Digit_Recognition_data/X.npy")
    y = np.load("Handwritten_Digit_Recognition_data/y.npy")
    X = X[0:1000]
    y = y[0:1000]
    return X, y


# 加载数据集,查看数据集大小,可以看到有1000个数据集,每个输入是20*20=400大小的图片
X, y = load_data()
print('The shape of X is: ' + str(X.shape))
print('The shape of y is: ' + str(y.shape))
X_train, X_test, y_train, y_test = train_test_split(X, y, test_size=0.1, random_state=42)

# # 下面画图,随便从原数据取出几个画图,可以注释
# m, n = X.shape
# fig, axes = plt.subplots(8, 8, figsize=(8, 8))
# fig.tight_layout(pad=0.1)
# for i, ax in enumerate(axes.flat):
#     # Select random indices
#     random_index = np.random.randint(m)
#     # Select rows corresponding to the random indices and
#     # 将1*400的数据转换为20*20的图像格式
#     X_random_reshaped = X[random_index].reshape((20, 20)).T
#     # Display the image
#     ax.imshow(X_random_reshaped, cmap='gray')
#     # Display the label above the image
#     ax.set_title(y[random_index, 0])
#     ax.set_axis_off()
# plt.show()

# 构建模型,三层模型进行分类,第一层输入25个神经元...
model = Sequential(
    [
        tf.keras.Input(shape=(400,)),    #specify input size
        ### START CODE HERE ###
        Dense(100, activation='sigmoid'),
        Dense(10, activation='sigmoid'),
        Dense(1, activation='sigmoid')
        ### END CODE HERE ###
    ], name = "my_model"
)
# 打印三层模型的参数
model.summary()
# 模型设定,学习率0.001,因为是分类,使用BinaryCrossentropy损失函数
model.compile(
    loss=tf.keras.losses.BinaryCrossentropy(),
    optimizer=tf.keras.optimizers.Adam(0.001),
)
# 开始训练,训练循环20
model.fit(
    X_train,y_train,
    epochs=20
)

# 绘制测试集的预测结果,绘制64个
fig, axes = plt.subplots(8, 8, figsize=(8, 8))
fig.tight_layout(pad=0.1, rect=[0, 0.03, 1, 0.92])  # [left, bottom, right, top]
for i, ax in enumerate(axes.flat):
    # Select random indices
    random_index = np.random.randint(X_test.shape[0])

    # Select rows corresponding to the random indices and
    # reshape the image
    X_random_reshaped = X_test[random_index].reshape((20, 20)).T

    # Display the image
    ax.imshow(X_random_reshaped, cmap='gray')

    # Predict using the Neural Network
    prediction = model.predict(X_test[random_index].reshape(1, 400))
    if prediction >= 0.5:
        yhat = 1
    else:
        yhat = 0
    # Display the label above the image
    ax.set_title(f"{y_test[random_index, 0]},{yhat}")
    ax.set_axis_off()
fig.suptitle("真实标签, 预测的标签", fontsize=16)
plt.show()

# 给出预测的测试集误差
y_pred=model.predict(X_test)
print("测试数据集准确率为:", accuracy_score(y_test, np.round(y_pred)))
原文地址:https://blog.csdn.net/weixin_44584198/article/details/134587008
本文来自互联网用户投稿,该文观点仅代表作者本人,不代表本站立场。本站仅提供信息存储空间服务,不拥有所有权,不承担相关法律责任。
如若转载,请注明出处:http://www.7code.cn/show_16763.html
如若内容造成侵权/违法违规/事实不符,请联系代码007邮箱:suwngjj01@126.com进行投诉反馈,一经查实,立即删除!


