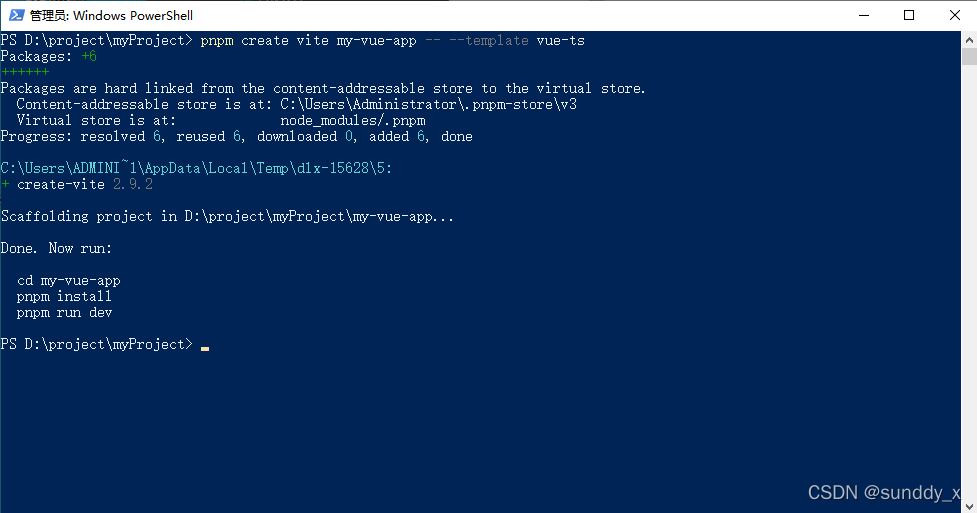
此处使用 pnpm 构建项目,npm及yarn请查看官方文档。
pnpm create vite my-vue-app -- --template vue-ts

使用vscode打开项目,新建终端,执行 pnpm install 或 pnpm i 安装依赖。执行 pnpm run dev 或 pnpm dev 运行项目:

pnpm add echarts
<script setup lang="ts">
import { onMounted } from 'vue';
import { EChartsOption, init } from 'echarts';
onMounted(() => {
// 获取dom,断言HTMLElement类型,否则会报错
const chartEle: HTMLElement = document.getElementById('chart') as HTMLElement;
const chart = init(chartEle);
const option: EChartsOption = {
xAxis: {
type: 'category',
data: ['Mon', 'Tue', 'Wed', 'Thu', 'Fri', 'Sat', 'Sun']
},
yAxis: {
type: 'value'
},
series: [
{
data: [150, 230, 224, 218, 135, 147, 260],
type: 'line'
}
]
};
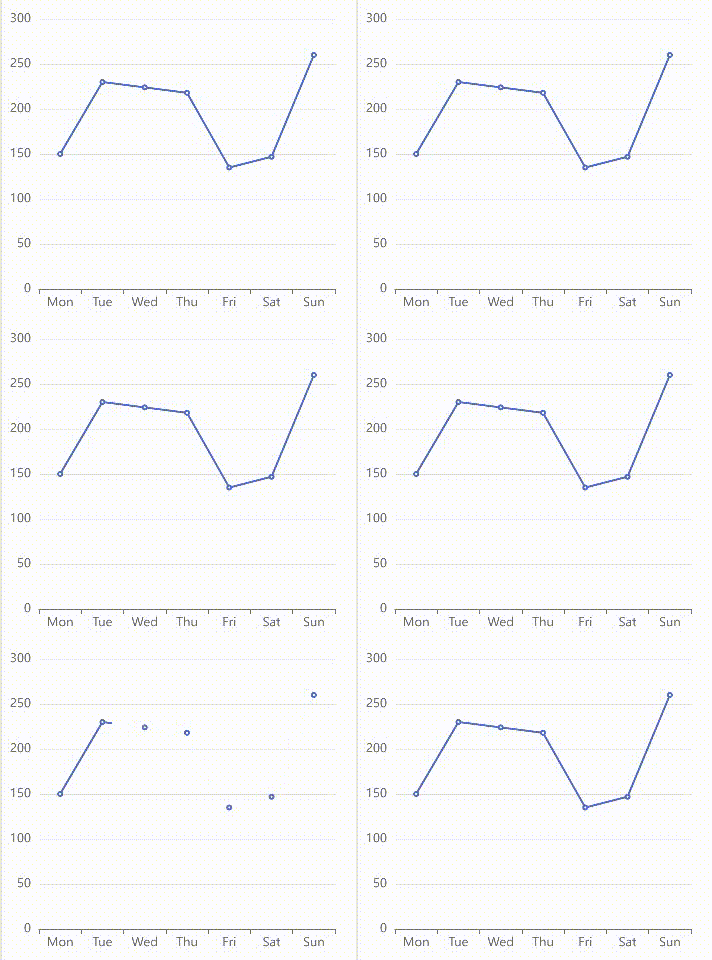
option && chart.setOption(option);
})
</script>
<template>
<div id="chart"></div>
</template>
<style>
#app {
font-family: Avenir, Helvetica, Arial, sans-serif;
-webkit-font-smoothing: antialiased;
-moz-osx-font-smoothing: grayscale;
text-align: center;
color: #2c3e50;
margin-top: 60px;
}
#chart {
width: 600px;
height: 400px;
}
</style>
<script setup lang="ts">
import { onMounted, Ref, ref } from 'vue'
import { ECharts, EChartsOption, init } from 'echarts'

let chart: ECharts;
const chartRef: Ref<HTMLElement | null> = ref(null)

const initChart = () => {
  const option: EChartsOption = {
    xAxis: {
      type: 'category'
    },
    yAxis: {
      type: 'value'
    },
    series: [
      {
        type: 'line'
      }
    ]
  };
  chart.setOption(option);
}
const updateChart = () => {
  const option: EChartsOption = {
    xAxis: {
      data: ['Mon', 'Tue', 'Wed', 'Thu', 'Fri', 'Sat', 'Sun']
    },
    series: [
      {
        data: [150, 230, 224, 218, 135, 147, 260]
      }
    ]
  };
  chart.setOption(option);
}

onMounted(() => {
  chart = init(chartRef.value as HTMLElement)
  initChart()
  // 延时2秒后执行增量更新
  setTimeout(() => {
    updateChart()
  }, 2000)
})
</script>

<template>
  <div class="chart" ref="chartRef"></div>
</template>

<style scoped>
.chart {
  width: 100%;
  height: 400px;
}
</style>

<script setup lang="ts">
import { onMounted, onUnmounted, Ref, ref } from 'vue'
import { ECharts, EChartsOption, init } from 'echarts'
let chart: ECharts;
const chartRef: Ref<HTMLElement | null> = ref(null)
// 初始化图表
const initChart = () => {
const option: EChartsOption = {
xAxis: {
type: 'category'
},
yAxis: {
type: 'value'
},
series: [
{
type: 'line'
}
]
};
chart.setOption(option);
}
// 更新图表
const updateChart = () => {
const option: EChartsOption = {
xAxis: {
data: ['Mon', 'Tue', 'Wed', 'Thu', 'Fri', 'Sat', 'Sun']
},
series: [
{
data: [150, 230, 224, 218, 135, 147, 260]
}
]
};
chart.setOption(option);
}
// 声明定时器
let interval: number | null = null;
onMounted(() => {
chart = init(chartRef.value as HTMLElement)
initChart()
// 延时2秒后执行增量更新
setTimeout(() => {
updateChart()
}, 2000)
// 添加定时器,每隔5秒重新渲染图表
interval = setInterval(() => {
chart.clear()
initChart()
updateChart()
}, 5000)
})
// 卸载组件时清除定时器
onUnmounted(() => {
interval && clearInterval(interval)
})
</script>
<template>
<div class="chart" ref="chartRef"></div>
</template>
<style scoped>
.chart {
width: 370px;
height: 400px;
}
</style>
原文地址:https://blog.csdn.net/sunddy_x/article/details/124432548
本文来自互联网用户投稿,该文观点仅代表作者本人,不代表本站立场。本站仅提供信息存储空间服务,不拥有所有权,不承担相关法律责任。
如若转载,请注明出处:http://www.7code.cn/show_16941.html
如若内容造成侵权/违法违规/事实不符,请联系代码007邮箱:suwngjj01@126.com进行投诉反馈,一经查实,立即删除!