echarts图标下钻的原理:点击图表 -> 销毁echarts(myChart.dispose()) -> 创建新的echarts(echarts.init) -> 替换数据源(setOption)(始终是一个图表,不断的销毁-创建–替换数据源来做到下钻和回到初始状态)
<template>
<ColumnarLine height="740px" ref="trendBar" @click="openDetail"></ColumnarLine>
</template>
<script>
import ColumnarLine from '../../components/echart/ColumnarLine.vue'
// echarts图标下钻的原理:(始终是一个图标,不断的销毁创建替换数据源来做到下钻和回到初始状态)
// 点击图表 -> 销毁echarts(myChart.dispose()) -> 创建新的echarts($echarts.init) -> 替换数据源(setOption)
export default {
components: { ColumnarLine },
data() {
return {
currentBarInfo: {
"title": {
"text": ""
},
"tooltip": {
"trigger": "axis"
},
"grid": {
"left": "1%",
"right": 20,
"bottom": "1%",
"containLabel": true
},
"xAxis": {
"type": "value"
},
"yAxis": {
"type": "category",
"data": [
"张三",
"王哈哈",
"李四"
],
"inverse": true
},
"dataGroupId": "",
"animationDurationUpdate": 500,
"color": [
"#FFC542",
"#3DD598",
"#50B5FF"
],
"series": [
{
"type": "bar",
"name": "指标一",
"data": [
{
"value": 0,
"groupId": "692469305737625540"
},
{
"value": 39,
"groupId": "1248743218"
},
{
"value": 0,
"groupId": "1486903246635360331"
}
],
"universalTransition": {
"enabled": true,
"divideShape": "clone"
}
},
{
"type": "bar",
"name": "指标二",
"data": [
{
"value": 0,
"groupId": "692469305737625540"
},
{
"value": 76,
"groupId": "1248743218"
},
{
"value": 0,
"groupId": "1486903246635360331"
}
],
"universalTransition": {
"enabled": true,
"divideShape": "clone"
}
},
{
"type": "bar",
"name": "指标三",
"data": [
{
"value": 0,
"groupId": "692469305737625540"
},
{
"value": 0,
"groupId": "1248743218"
},
{
"value": 0,
"groupId": "1486903246635360331"
}
],
"universalTransition": {
"enabled": true,
"divideShape": "clone"
}
}
]
}
};
},
mounted() {
// 第一层的图表
this.$refs['trendBar']?.drawEcharts(this.currentBarInfo);
},
methods: {
// 点击下钻
openDetail() {
this.reDraw({customerId: 1248743218, customerName: "王哈哈"})
},
// 下钻处理
reDraw(parms={}){
let {customerId, customerName} = parms;
let list = [
{
"yearDay": 20230217,
"yearMoth": 202302,
"yearFull": 2023,
"customerId": "1248743218",
"customerName": "王哈哈",
"departId": 697991942,
"allotNum": 17,
"handleNum": 36,
"timeoutNum": 0,
"checkNum": 35
},
{
"yearDay": 20230218,
"yearMoth": 202302,
"yearFull": 2023,
"customerId": "1248743218",
"customerName": "王哈哈",
"departId": 697991942,
"allotNum": 9,
"handleNum": 23,
"timeoutNum": 0,
"checkNum": 14
},
{
"yearDay": 20230219,
"yearMoth": 202302,
"yearFull": 2023,
"customerId": "1248743218",
"customerName": "王哈哈",
"departId": 697991942,
"allotNum": 0,
"handleNum": 0,
"timeoutNum": 0,
"checkNum": 0
},
{
"yearDay": 20230220,
"yearMoth": 202302,
"yearFull": 2023,
"customerId": "1248743218",
"customerName": "王哈哈",
"departId": 697991942,
"allotNum": 0,
"handleNum": 0,
"timeoutNum": 0,
"checkNum": 0
},
{
"yearDay": 20230221,
"yearMoth": 202302,
"yearFull": 2023,
"customerId": "1248743218",
"customerName": "王哈哈",
"departId": 697991942,
"allotNum": 4,
"handleNum": 8,
"timeoutNum": 0,
"checkNum": 6
},
{
"yearDay": 20230222,
"yearMoth": 202302,
"yearFull": 2023,
"customerId": "1248743218",
"customerName": "王哈哈",
"departId": 697991942,
"allotNum": 5,
"handleNum": 5,
"timeoutNum": 0,
"checkNum": 3
},
{
"yearDay": 20230223,
"yearMoth": 202302,
"yearFull": 2023,
"customerId": "1248743218",
"customerName": "王哈哈",
"departId": 697991942,
"allotNum": 4,
"handleNum": 4,
"timeoutNum": 0,
"checkNum": 0
}
]
let tips = '每日';
let onlineType = 'day'
// repainChart是组件里面的自定义事件,主要干销毁/创建/替换数据源几件事
this.$refs['trendBar']?.repainChart({
title:[
{
text: customerName+` - ${tips}指标一`,
textStyle: {fontSize: 18, fontWeight: 'normal' },
top: 40 // 设置标题的位置
},
{
text: customerName+` - ${tips}指标二`,
textStyle: {fontSize: 18, fontWeight: 'normal' },
top: 280
},
{
text: customerName+` - ${tips}指标三`,
textStyle: {fontSize: 18, fontWeight: 'normal' },
top: 530
},
],
legend: {show: false},
tooltip: {
trigger: 'axis',
valueFormatter: (value) => value
},
color: ['#FFC542', '#3DD598', '#50B5FF'],
xAxis: [ // gridIndex: x 轴所在的 grid 的索引,默认位于第一个 grid
{
type: 'category',
gridIndex: 0,top: 40, bottom: '33%', left: 5,
data: list.map(item=>item[onlineType == 'day'?'yearDay':'yearMoth'])
},
{
type: 'category',top: '34%', bottom: '66%', left: 5,
gridIndex: 1,
data: list.map(item=>item[onlineType == 'day'?'yearDay':'yearMoth'])
},
{
type: 'category',top: '67%', bottom: '100%', left: 5,
gridIndex: 2,
data: list.map(item=>item[onlineType == 'day'?'yearDay':'yearMoth'])
}
],
grid: [ // 设置图表位置
{top: 80, left: 30, right: 30, height: 150},
{top: 320, left: 30, right: 30, height: 150},
{top: 570, left: 30, right: 30, height: 150}
],
yAxis:[
{type: 'value', gridIndex: 0},
{type: 'value', gridIndex: 1},
{type: 'value', gridIndex: 2}
],
series: [
{
type: 'bar',
name:"指标一",
gridIndex: 0,
xAxisIndex: 0,
yAxisIndex: 0,
dataGroupId: customerId,
data: list.map(item=>item.allotNum||0),
universalTransition: { // 全局过渡动画配置
enabled: true, // enabled
divideShape: 'clone'
}
},
{
type: 'bar',
name:"指标二",
gridIndex: 1,
xAxisIndex: 1,
yAxisIndex: 1,
dataGroupId: customerId,
data: list.map(item=>item.handleNum||0),
universalTransition: {
enabled: true,
divideShape: 'clone'
}
},
{
type: 'line',
dataGroupId: customerId,
name:"指标三",
gridIndex: 2,
xAxisIndex: 2,
yAxisIndex: 2,
data: list.map(item=>item.timeoutNum||0),
universalTransition: {
enabled: true,
divideShape: 'clone'
}
}
],
graphic: [
{
type: 'text',
left: 0,
top: 0,
style: {
text: 'Back',
fontSize: 20,
},
onclick: (e)=> {
// 添加重置事件,用于回到初始图表
this.$refs['trendBar']?.drawEcharts(this.currentBarInfo)
}
}
]
})
}
},
};
</script>
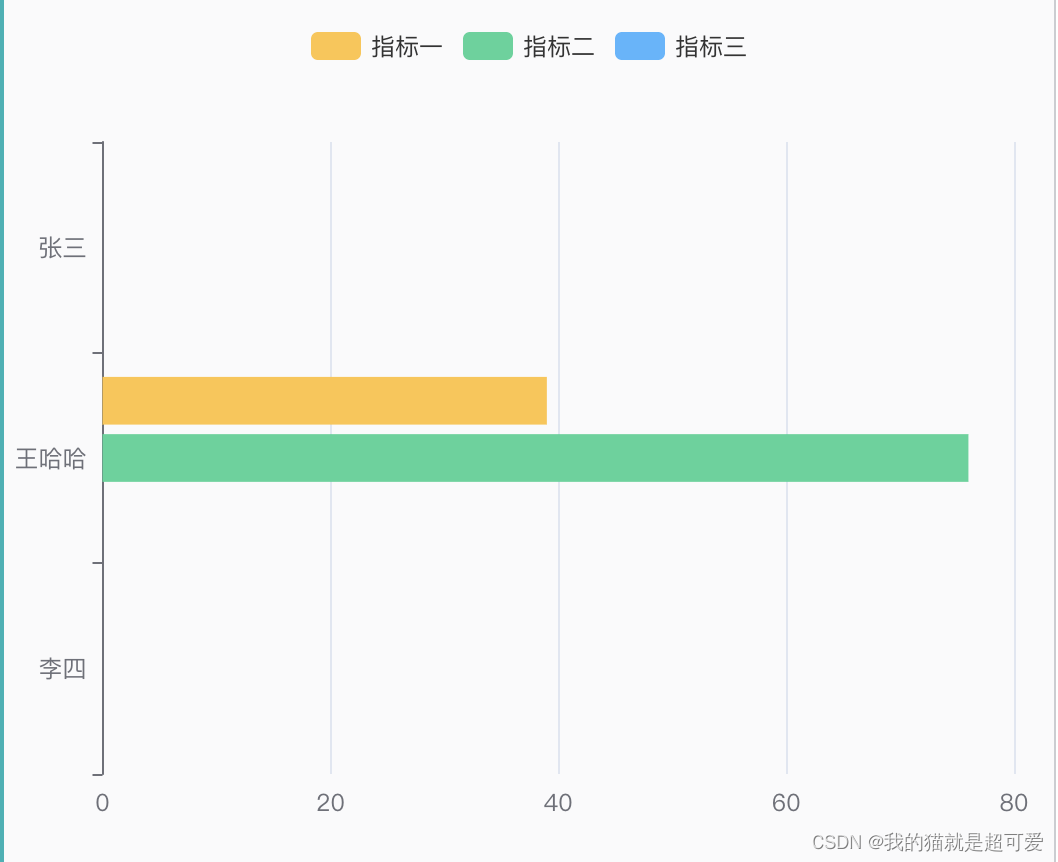
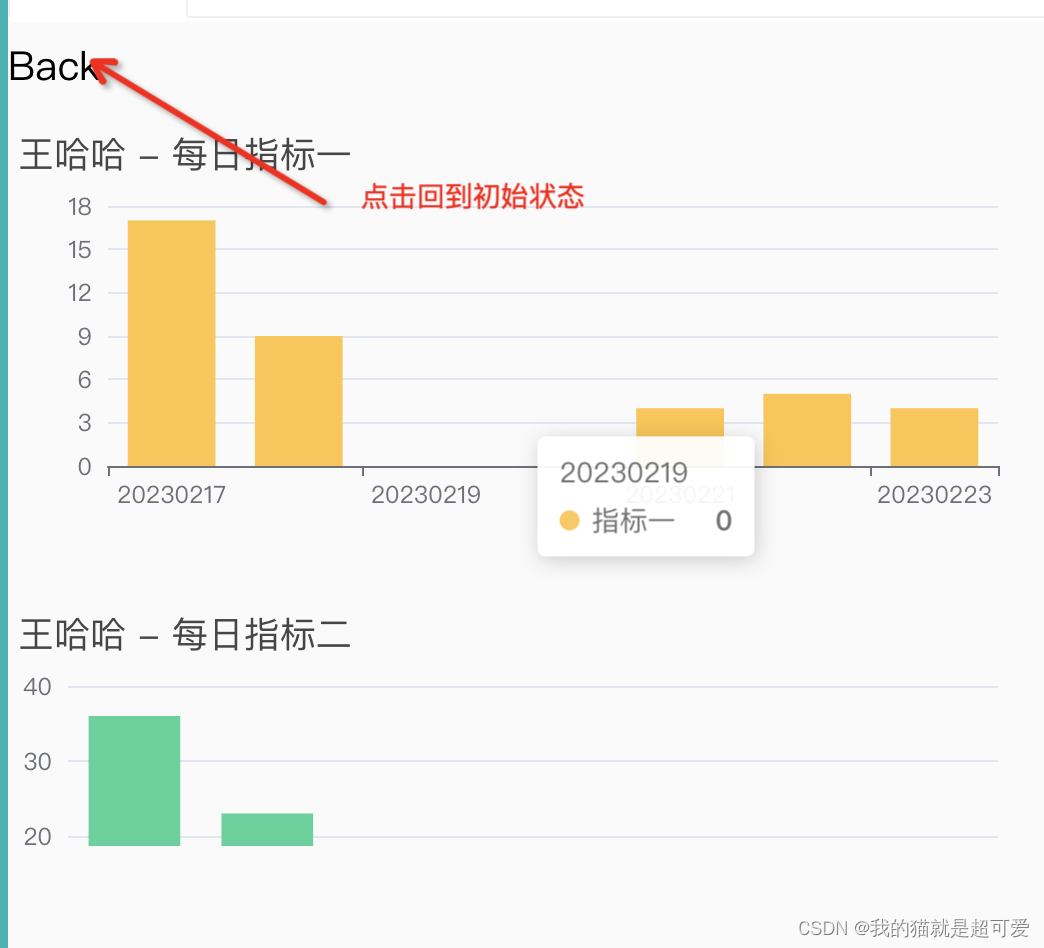
效果:
下钻效果图:
<template>
<!-- 柱折结合 -->
<div :id="echartsId" :style="{ height }"></div>
</template>
<script lang="ts" setup>
// 引入部分
import { defineComponent, reactive, toRefs,getCurrentInstance, ref, onMounted} from 'vue';
const { proxy } = getCurrentInstance()
// props
const props = defineProps({
echartsId: { //ID
type: [String, Number],
default: 'myecharts'
},
height: {
type: String,
default: '370px'
},
})
const emit= defineEmits(['click'])
let myChart = null;
// 方法
const drawEcharts = function(echartConfigure) {
if(myChart != null && myChart != "" && myChart != undefined){
myChart.dispose(); // 存在echarts时,销毁
}
myChart = proxy.$echarts.init(document.getElementById(props.echartsId));
myChart.setOption({
title: Object.assign(
{text:"", textStyle: {fontSize: 18, fontWeight: 'normal' }},echartConfigure.title||{text:""}
),
tooltip: Object.assign({
trigger: 'axis',
textStyle:{
align:'left'
},
axisPointer: {
type: 'cross',
crossStyle: {
color: '#999', //鼠标水平线颜色
}
}
},echartConfigure.tooltip),
grid: Object.assign(
{ //留个占位,后面再配
},
echartConfigure.grid
),
dataset: echartConfigure.dataset||[],
dataGroupId: echartConfigure.dataGroupId||'',
animationDurationUpdate: echartConfigure.animationDurationUpdate||0,
toolbox: {
show: false, //不展示右上角按钮
},
color : echartConfigure.color, //颜色配置
legend: echartConfigure.legend||{},
xAxis: echartConfigure.xAxis||[],
yAxis: echartConfigure.yAxis||[
{
type: 'value'
},
{
type: 'value'
},
],
series: echartConfigure.series||[]
});
// 添加点击事件
myChart.on('click', function (event) {
emit('click',event)
})
}
//
const repainChart = function(options){
myChart = proxy.$echarts.init(document.getElementById(props.echartsId));
myChart.setOption(options)
}
// 暴露给父组件使用
defineExpose({
// 声明方法
drawEcharts,
repainChart
})
</script>
<style scoped lang="less">
</style>
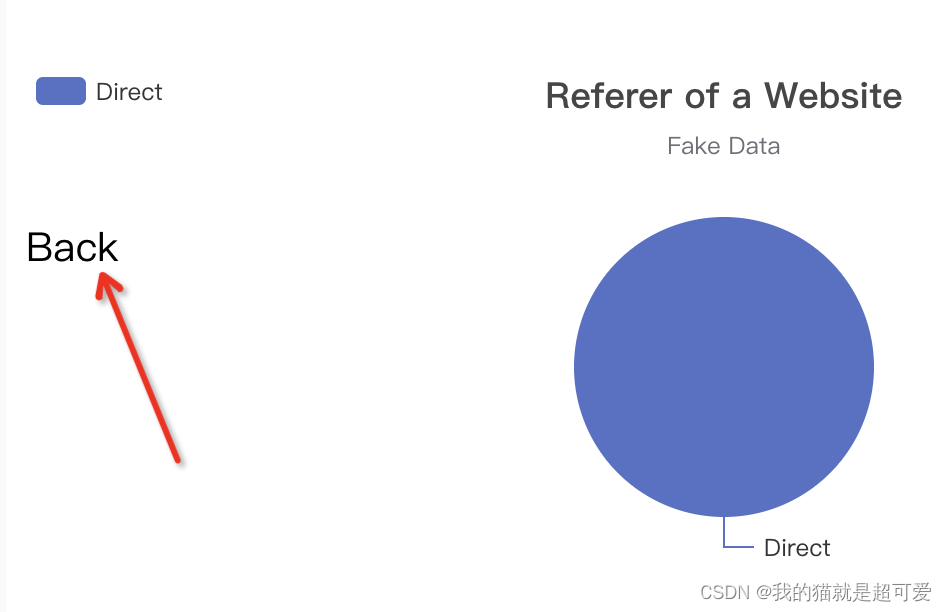
例二:

<template>
<div :id="echartsId" :style="{ height }"></div>
</template>
<script lang="ts" setup>
// 引入部分
import { getCurrentInstance, onMounted, ref } from "vue";
import chinaGeo from "@/assets/json/china.json";
const { proxy } = getCurrentInstance();
// props
const props = defineProps({
echartsId: {
//ID
type: [String, Number],
default: "chinaEcharts",
},
height: {
type: [String, Number],
default: "300px",
}
});
const baseOption=ref({
title: {
text: 'Referer of a Website',
subtext: 'Fake Data',
left: 'center'
},
tooltip: {
trigger: 'item'
},
legend: {
orient: 'vertical',
left: 'left'
},
series: [
{
name: 'Access From',
type: 'pie',
radius: '50%',
data: [
{ value: 735, name: 'Direct' },
{ value: 1048, name: 'Search Engine' },
{ value: 580, name: 'Email' },
{ value: 484, name: 'Union Ads' },
{ value: 300, name: 'Video Ads' }
],
emphasis: {
itemStyle: {
shadowBlur: 10,
shadowOffsetX: 0,
shadowColor: 'rgba(0, 0, 0, 0.5)'
}
}
}
],
})
// 生命周期
let myChart = null;
const drawMap = function (echartConfigure) {
if(myChart != null && myChart != "" && myChart != undefined){
myChart.dispose();
}
myChart = proxy.$echarts.init(document.getElementById(props.echartsId));
proxy.$echarts.registerMap("china", chinaGeo); //省份数据
myChart.setOption(baseOption.value);
myChart.on('click', function (event) {
repainChart({
title: {
text: 'Referer of a Website',
subtext: 'Fake Data',
left: 'center'
},
tooltip: {
trigger: 'item'
},
legend: {
orient: 'vertical',
left: 'left'
},
series: [
{
name: 'Access From',
type: 'pie',
radius: '50%',
data: [
{ value: 735, name: 'Direct' },
],
emphasis: {
itemStyle: {
shadowBlur: 10,
shadowOffsetX: 0,
shadowColor: 'rgba(0, 0, 0, 0.5)'
}
}
}
],
graphic: [
{
type: 'text',
left: 0,
top: 80,
style: {
text: 'Back',
fontSize: 20
},
onclick: function (e) {
drawMap(baseOption.value)
}
}]
})
})
};
const repainChart = function(options){
myChart = proxy.$echarts.init(document.getElementById(props.echartsId));
myChart.setOption(options)
}
defineExpose({
drawMap,
});
</script>
<style scoped lang="less">
</style>
原文地址:https://blog.csdn.net/weixin_58031521/article/details/129204787
本文来自互联网用户投稿,该文观点仅代表作者本人,不代表本站立场。本站仅提供信息存储空间服务,不拥有所有权,不承担相关法律责任。
如若转载,请注明出处:http://www.7code.cn/show_17005.html
如若内容造成侵权/违法违规/事实不符,请联系代码007邮箱:suwngjj01@126.com进行投诉反馈,一经查实,立即删除!
主题授权提示:请在后台主题设置-主题授权-激活主题的正版授权,授权购买:RiTheme官网
声明:本站所有文章,如无特殊说明或标注,均为本站原创发布。任何个人或组织,在未征得本站同意时,禁止复制、盗用、采集、发布本站内容到任何网站、书籍等各类媒体平台。如若本站内容侵犯了原著者的合法权益,可联系我们进行处理。