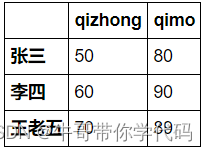
举个例子进行对比
chengji=[['', '期末', '期末'], ['张三',50, 80], ['李四', 60, 90], ['王老五', 70, 89]]
np.array(chengji)

#array([['', '期末', '期末'],
#['张三', '50', '80'],
#['李四', '60', '90'],
#['王老五', '70', '89']], dtype='<U3')dic={ ' 期 中 ':[50,60,70], ' 期 末':[80,90,89]}
pd.DataFrame(dic,index=['张三','李四','王老五'])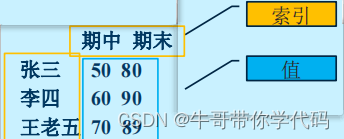
Pandas库简介
pandas扩展包的安装
pandas扩展包的调用
pandas数据结构
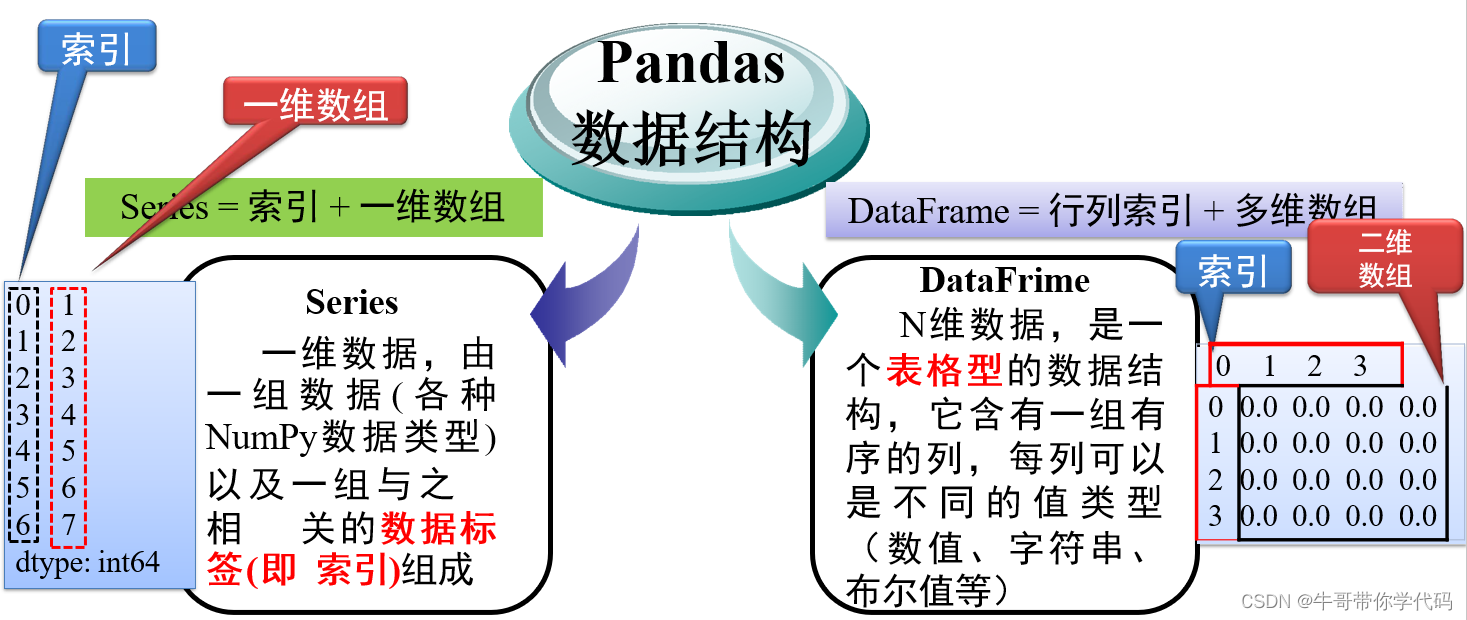
pandas库的理解
| Numpy | Pandas |
|
基础数据类型
|
|
| 维度:数据间的关系 |
np.arange(4)

#array([0,1,2,3])pd.Series(np.arange(4))
#0 0
#1 1
#2 2
#3 3
#dtype: int32可以看出使用pandas库可视化程度更高,能以比较清晰直观的形式展现处理后的数据
series对象类型
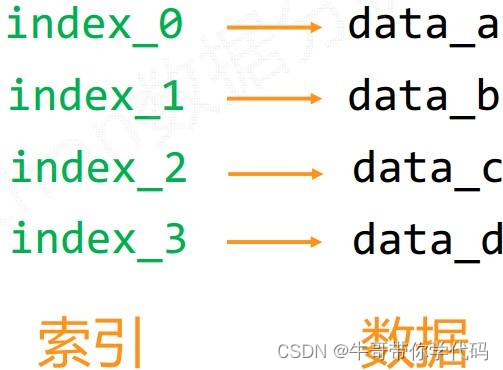
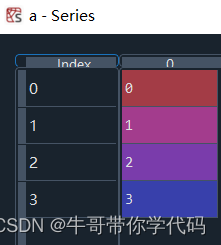
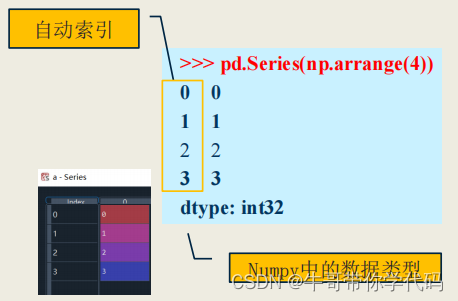
并存,但不能混用
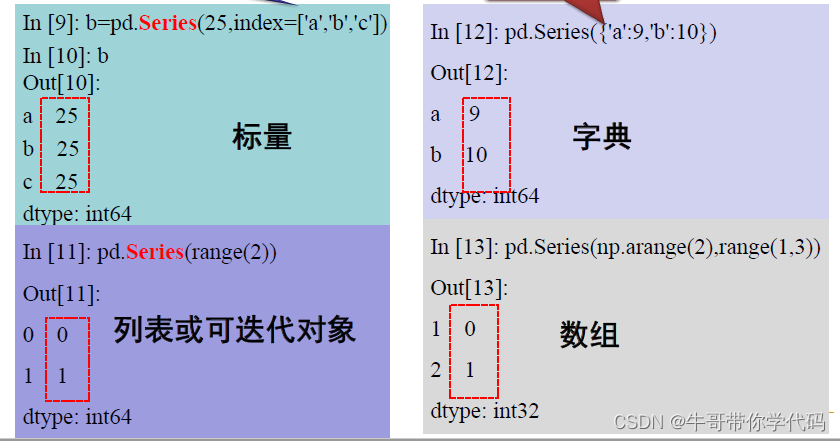
创建时注意事项
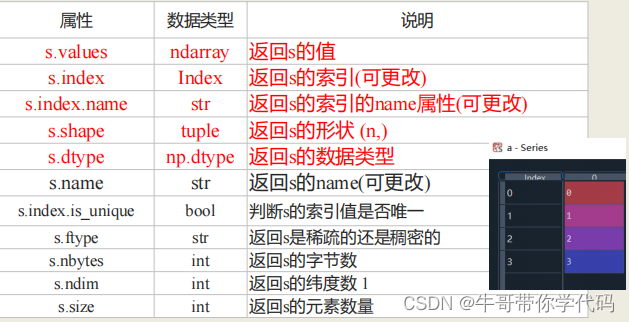
b=pd.Series([9,8,7],['a','b','c'])
#b
#a 9
#b 8
#c 7
#dtype: int64>>> b.values
array([9, 8, 7], dtype=int64)
>>>b.index #索引
Index(['a', 'b', 'c'], dtype='object’)>>> b.index.name='索引' #定义索引的名字
>>> b.name='Series对象' #对象名
>>> b
索引
a 9
b 8
c 7
Name: Series对象, dtype: int64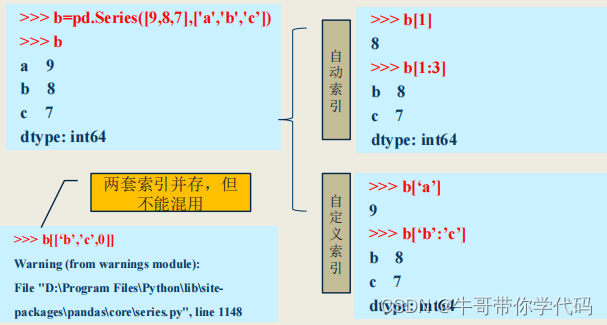
>>> b=pd.Series([9,8,7],['a','b','c'])
>>> b
a 9
b 8
c 7
dtype: int64

>>> b[b>=b.median()]
a 9
b 8
dtype: int64

>>> np.exp(b)
a 8103.083928
b 2980.957987
c 1096.633158
d 403.428793
dtype: float64>>> b=pd.Series([9,8,7],['a','b','c'])
>>> b
a 9
b 8
c 7
dtype: int64
>>> b['a']
9
>>> 'c' in b
True
>>> b.get('a')
9series常用函数
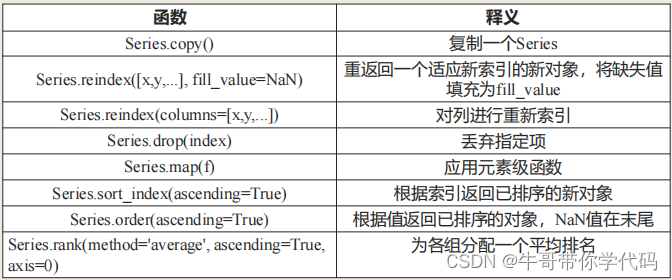
DataFrame对象类型
- DataFrame类型由共用相同索引的一组列组成。
- DataFrame是一个表格型的数据类型,每列值类型可以不同
- DataFrame既有行索引(index)、也有列索引(columns)
- DataFrame常用于表达二维数据,但可以表达多维数据。


DataFrame创建

df=pd.DataFrame(np.random.randint(60,100,size=(2,3)),index=['期中','期末'],columns=['张三','李四','王老五'])

>>> df.values
array([[70, 92, 72],
[60, 60, 88]])
>>> df.shape
(2,3)

>>> df.index
Index(['期中', '期末'], dtype='object')
>>> df.columns
Index(['张三', '李四', '王老五'], dtype='object')

>>> df.describe()
张三 李四 王老五
count 2.000000 2.000000 2.000000
mean 65.000000 76.000000 80.000000
std 7.071068 22.627417 11.313708
min 60.000000 60.000000 72.000000
25% 62.500000 68.000000 76.000000
50% 65.000000 76.000000 80.000000
75% 67.500000 84.000000 84.000000
max 70.000000 92.000000 88.000000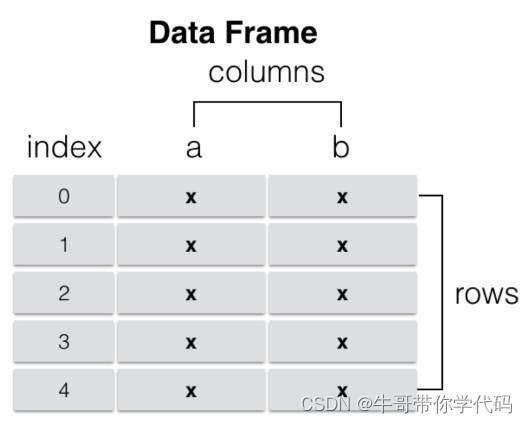
根据行列参数索引。
>>> df.['x']
a 0
b 3
c 6
Name: x, dtype: int32根据整数位置参数索引
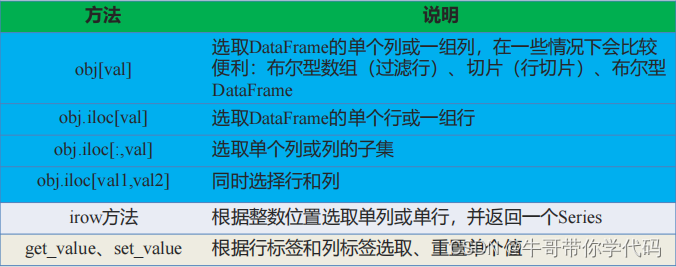
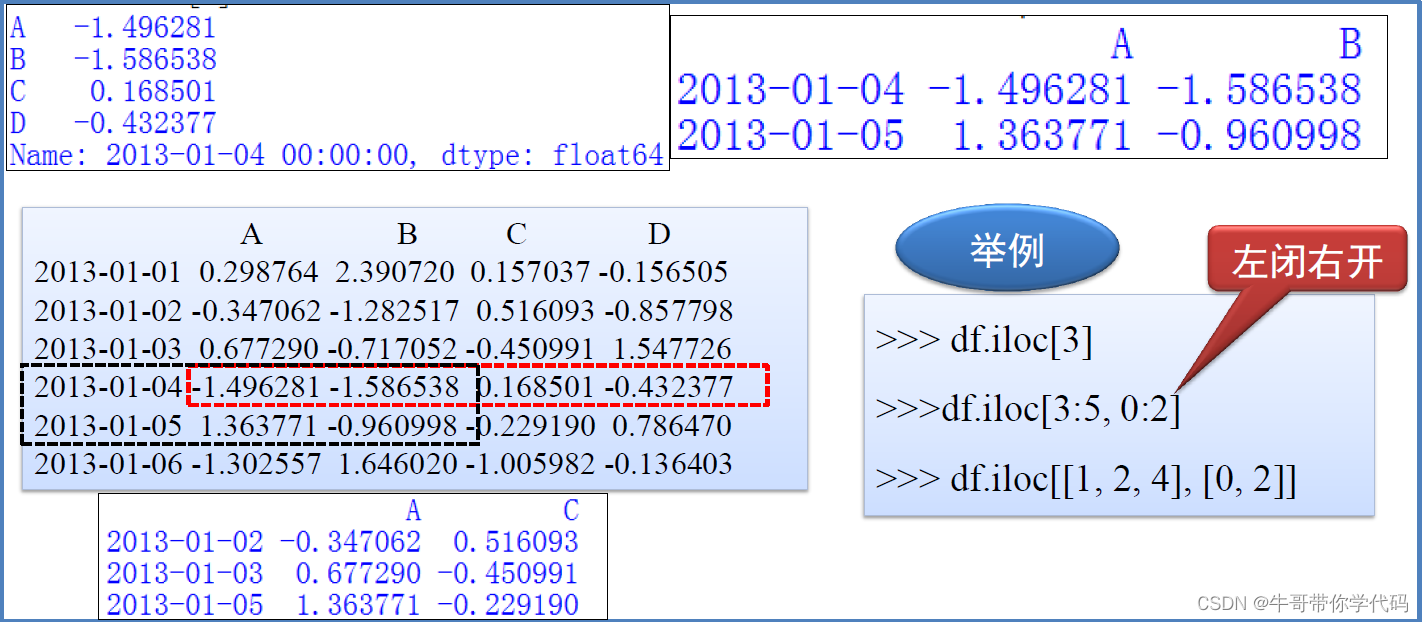
>>> df.iloc[1,:]
x 3
y 4
z 5
Name:b, dtype: int32某个轴上拥有多个索引级别
>>> df.['x','z']
a 0 2
b 3 5
c 6 8
列索引
通过类似字典的方式:
某一列
: obj[
列索引值
]
: obj[
列索引值
]
>>> df['qizhong']
张三 50
李四 60
王老五 70
Name: qizhong, dtype: int64
多列
: obj[
列索引值列表
]
: obj[
列索引值列表
]
>>> df[['qizhong', 'qimo']]
qizhong qimo
张三 50 80
李四 60 90
王老五 70 89
行索引
连续索引与不连续索引
df=pd.DataFrame(np.arange(16).reshape((4,4)),index=["a","b","c","d"],columns=["w","x","y","z"])
连续索引:索引值为切片
>>> df.loc['a':'c']
>>> df.iloc[:3, :]
w x y z
a 0 1 2 3
b 4 5 6 7
c 8 9 10 11
不连续索引:索引值为列表
>>> df[['w', 'y']]
>>> df.iloc[:, [0,2]]
w y
a 0 2
b 4 6
c 8 10
d 12 14
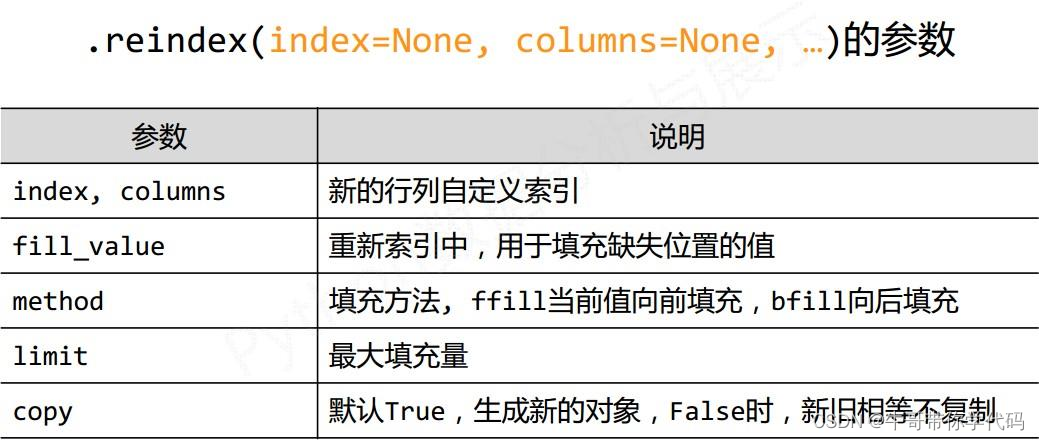
重新索引
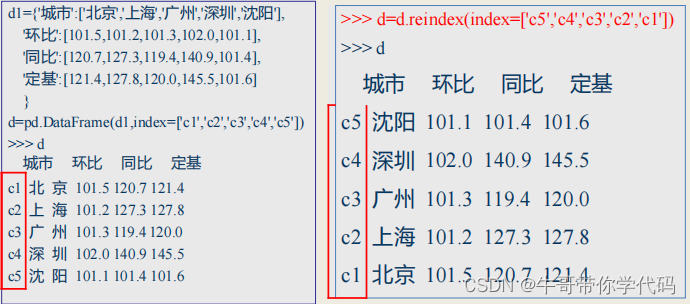
删除指定索引
pd.drop(labels, axis=0)>>> d
城市 环比 同比 定基
0 北京 101.5 120.7 121.4
1 上海 101.2 127.3 127.8
2 广州 101.3 119.4 120.0
3 深圳 102.0 145.5 125.3
4 沈阳 101.1 101.4 101.6>>> d.drop(3)
城市 环比 同比 定基
0 北京 101.5 120.7 121.4
1 上海 101.2 127.3 127.8
2 广州 101.3 119.4 120.0
4 沈阳 101.1 101.4 101.6
>>> d.drop('同比', axis =1)
城市 环比 定基
0 北京 101.5 121.4
1 上海 101.2 127.8
2 广州 101.3 120.0
4 沈阳 101.1 101.6Pandas库常用操作
算数运算法则
a=pd.DataFrame(np.arange(12).reshape((3,4)))
b=pd.DataFrame(np.arange(20).reshape((4,5)))
运算结果为浮点型;
>>> a
0 1 2 3
0 0 1 2 3
1 4 5 6 7
2 8 9 10 11

>>> b
0 1 2 3 4
0 0 1 2 3 4
1 5 6 7 8 9
2 10 11 12 13 14
3 15 16 17 18 19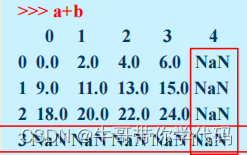
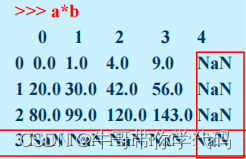
>>> a
0 1 2 3
0 0 1 2 3
1 4 5 6 7
2 8 9 10 11

>>> b
0 1 2 3 4
0 0 1 2 3 4
1 5 6 7 8 9
2 10 11 12 13 14
3 15 16 17 18 19

#加法
>>> b.add(a, fill_value=100)
0 1 2 3 4
0 0.0 2.0 4.0 6.0 104.0
1 9.0 11.0 13.0 15.0 109.0
2 18.0 20.0 22.0 24.0 114.0
3 115.0 116.0 117.0 118.0 119.0

#乘法
>>> b.mul(b, fill_value=0)
0 1 2 3 4
0 0.0 1.0 4.0 9.0 0.0
1 20.0 30.0 42.0 56.0 0.0
2 80.0 99.0 120.0 143.0 0.0
3 0.0 0.0 0.0 0.0 0.0Series与Dataframe之间的计算
组的运算,但可能出现
NaN
)
NaN
)
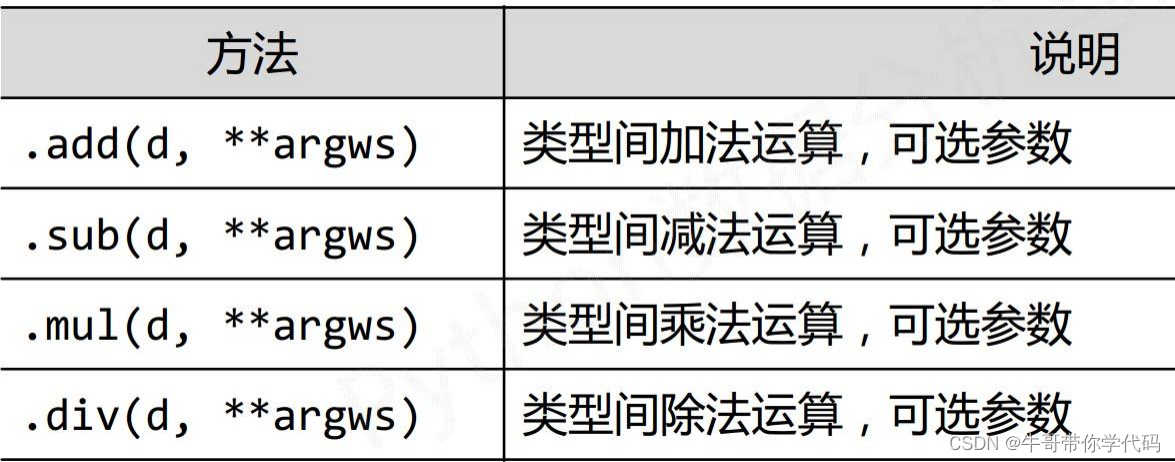
使用
pandas
操作函数:
pandas
操作函数:
传播运算(标量运算)
不同维度数据类型之间的运算。
>>> c=pd.Series(np.arange(3))
0 0
1 1
2 2
dtype: int32
>>> c+1
0 1
1 2
2 3
dtype: int32

>>> a=pd.DataFrame(np.arange(12).reshape((3,4)))
0 1 2 3
0 0 1 2 3
1 4 5 6 7
2 8 9 10 11
>>> a+1
0 1 2 3
0 1 2 3 4
1 5 6 7 8
2 9 10 11 12
组的运算,但可能出现
NaN
)
NaN
)
传播运算(标量运算)
不同维度数据类型之间的运算。
>>> c=pd.Series(np.arange(3))
0 0
1 1
2 2
dtype: int32
>>> c+1
0 1
1 2
2 3
dtype: int32

>>> a=pd.DataFrame(np.arange(12).reshape((3,4)))
0 1 2 3
0 0 1 2 3
1 4 5 6 7
2 8 9 10 11
>>> a+1
0 1 2 3
0 1 2 3 4
1 5 6 7 8
2 9 10 11 12算数运算(传播机制)
>>> c=pd.Series(np.arange(4))
>>> a=pd.DataFrame(np.arange(12).reshape((3,4)))

采用
> < >= <= == !=
等符号进行的二元运算产生布尔对象
> < >= <= == !=
等符号进行的二元运算产生布尔对象
>>> c=pd.Series(np.arange(4))
>>> a=pd.DataFrame(np.arange(12).reshape((3,4))) 

索引的排序
DataFrame.sort_values(by=‘##’,axis=0,ascending=True, inplace=False)

a = [[9,3,1],[1,2,8],[1,0,5]]
data = pd.DataFrame(a, index=["0", "2", "1"], columns=["c", "a", "b"])
idx = pd.MultiIndex.from_tuples([('a', 1), ('a', 2), ('a', 2), ('b', 2), ('b', 1), ('b', 1)])
idx.names = ['first', 'second']
df_multi = pd.DataFrame({'A': np.arange(6, 0, -1)}, index=idx) 
汇总和计算描述统计
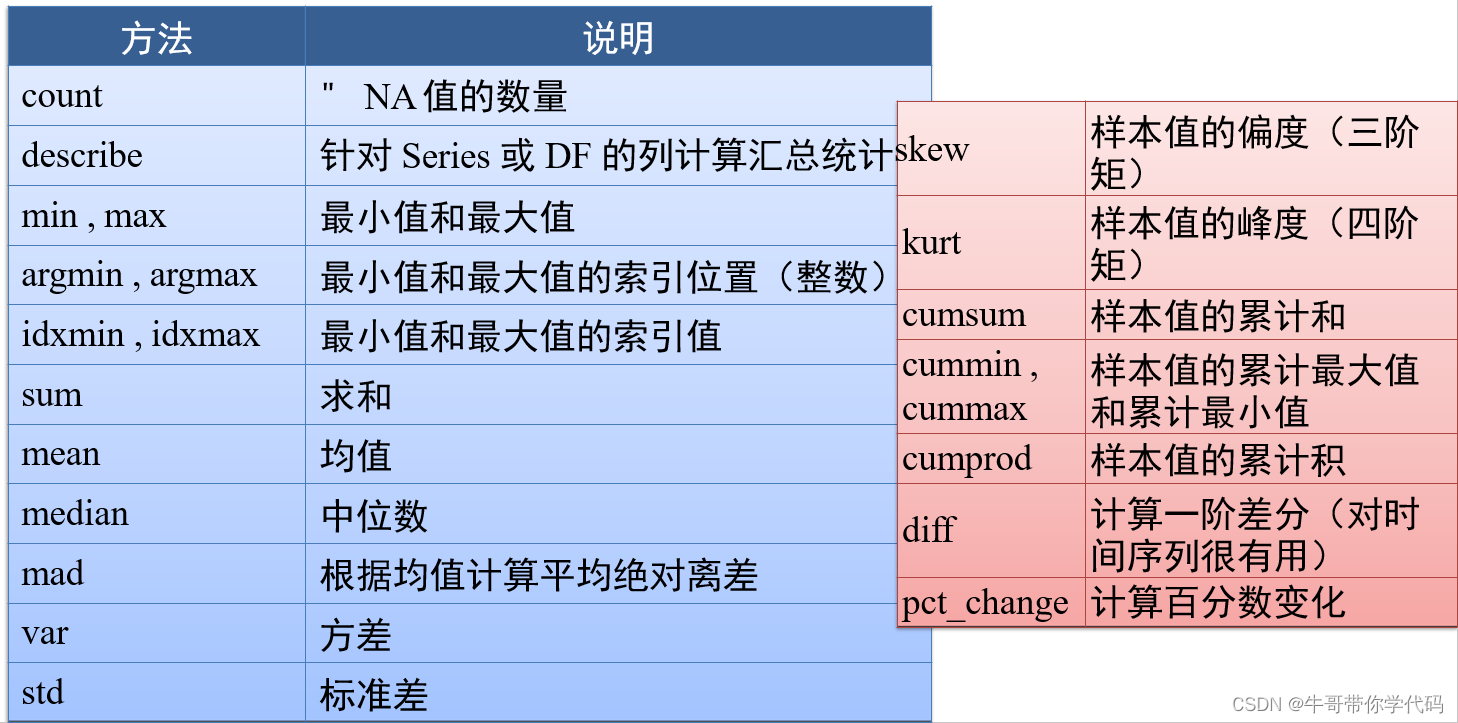
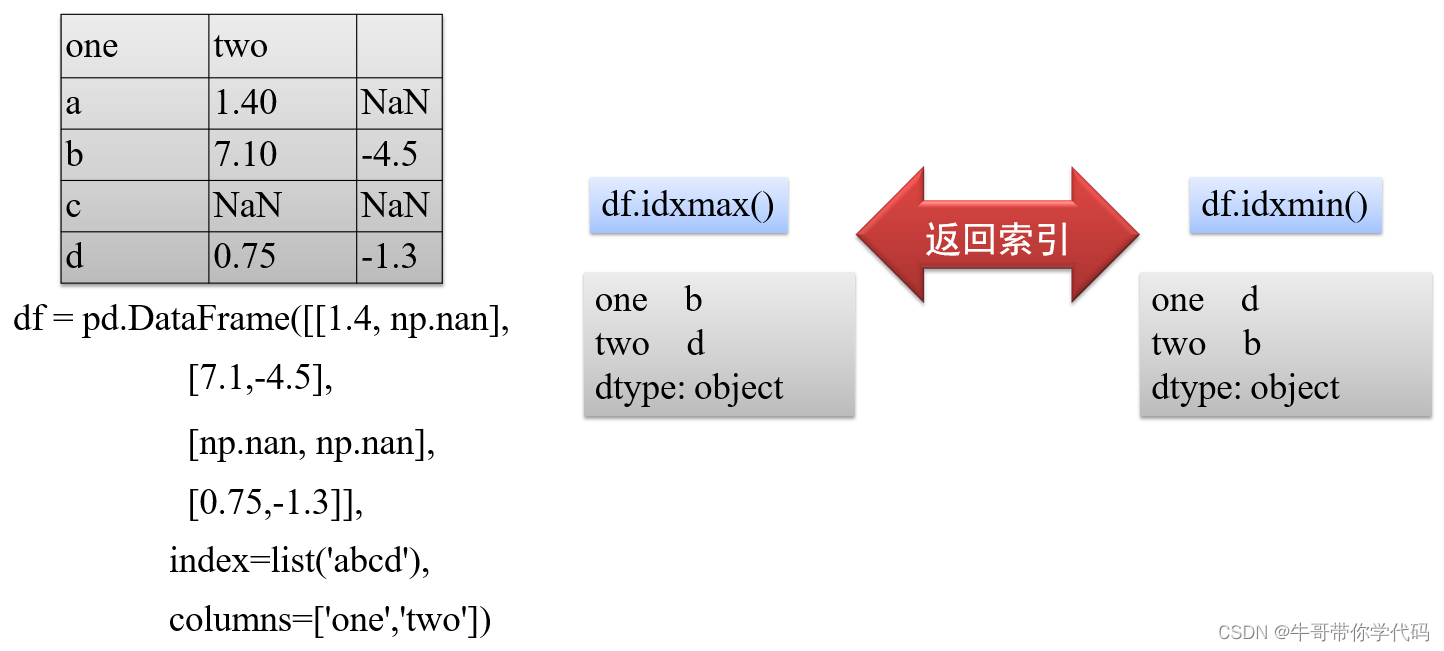

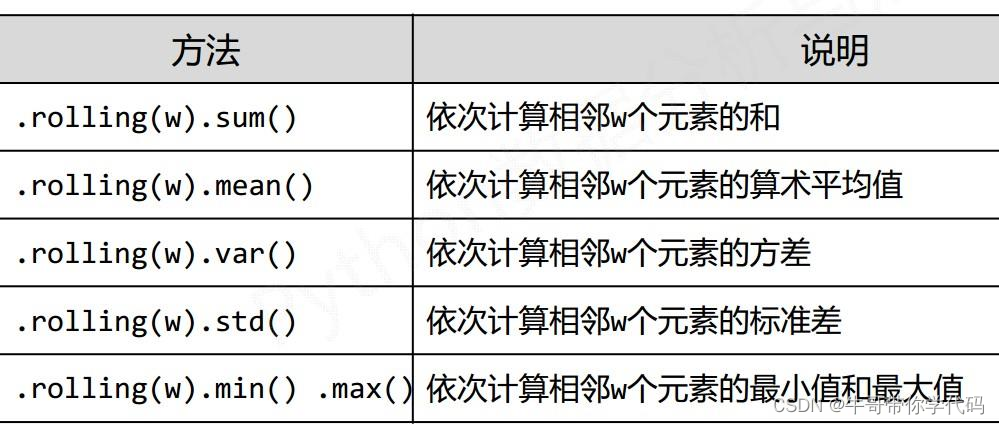
obj = pd.Series(['c','a','d','a','a','b','b','c','c'])serieris.unique():是以数组形式返回列的所有唯一值(特征的所有唯一值)
>>> uniques = obj.unique()
array(['c', 'a', 'd', 'b'], dtype=object)>>> name=["张三","李四 ","王五"]
>>> idx=["指标1","指标2","指标3","指标4"]
>>>df=pd.DataFrame(np.random.randint(67,80,12).reshape((3,4)),index=name,colum
ns=idx)
>>> df.apply(lambda x:((x-min(x))/(max(x)-min(x)),axis=1)指标1 指标2 指标3 指标4
张三 70 70 72 77
李四 79 67 73 74
王五 67 74 69 724
|
V
指标1 指标2 指标3 指标4
张三 0.0 0.0 0.285714 1.000000
李四 1.0 0.0 0.500000 0.583333
王五 0.0 1.0 0.285714 0.714286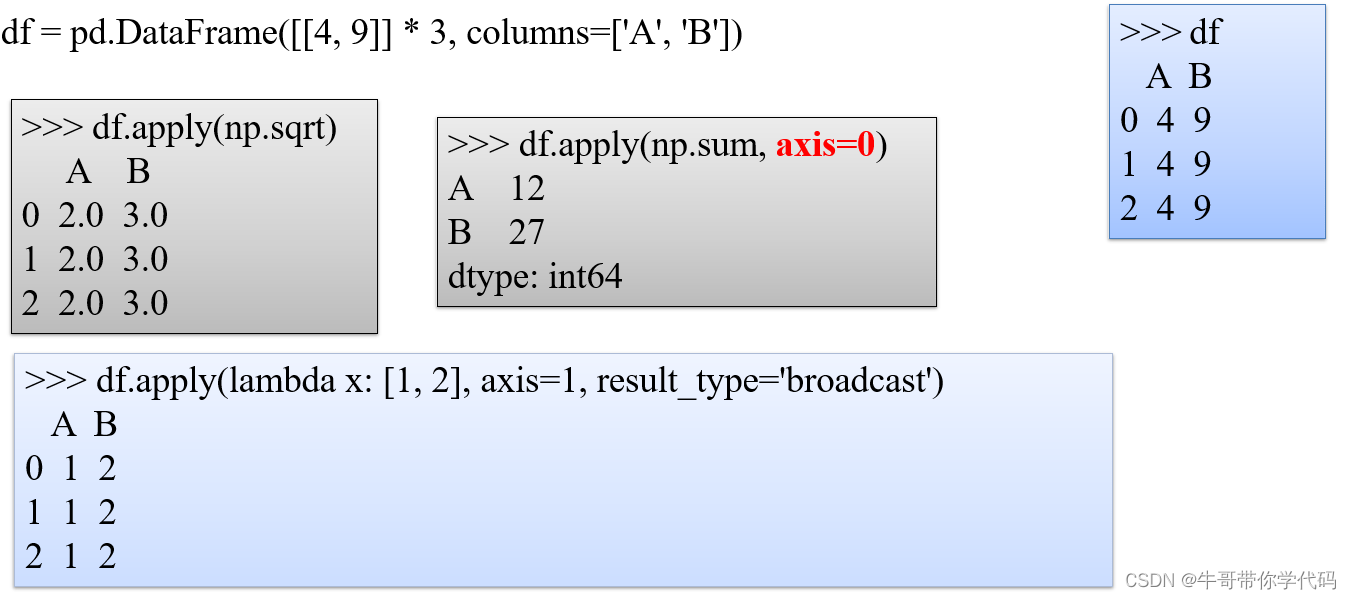
原文地址:https://blog.csdn.net/weixin_60535956/article/details/127982314
本文来自互联网用户投稿,该文观点仅代表作者本人,不代表本站立场。本站仅提供信息存储空间服务,不拥有所有权,不承担相关法律责任。
如若转载,请注明出处:http://www.7code.cn/show_20130.html
如若内容造成侵权/违法违规/事实不符,请联系代码007邮箱:suwngjj01@126.com进行投诉反馈,一经查实,立即删除!
声明:本站所有文章,如无特殊说明或标注,均为本站原创发布。任何个人或组织,在未征得本站同意时,禁止复制、盗用、采集、发布本站内容到任何网站、书籍等各类媒体平台。如若本站内容侵犯了原著者的合法权益,可联系我们进行处理。

