本文介绍: 公司新需求需要导出ppt给业务用,查阅资料后发现也挺简单的,记录一下。如有不懂的可以留言!!!1.安装包npm install pptxgenjs –save2.引入包在需要使用的文件中引入import Pptxgenfrom “pptxgenjs”
前言
公司新需求需要导出ppt给业务用,查阅资料后发现也挺简单的,记录一下。
如有不懂的可以留言!!!
1.安装包
npm install pptxgenjs --save
2.引入包
在需要使用的文件中引入
import Pptxgenfrom "pptxgenjs"
导出事件
<Button type="primary" @click="exportPPT">导出周报</Button>
这里有几个注意点说一下
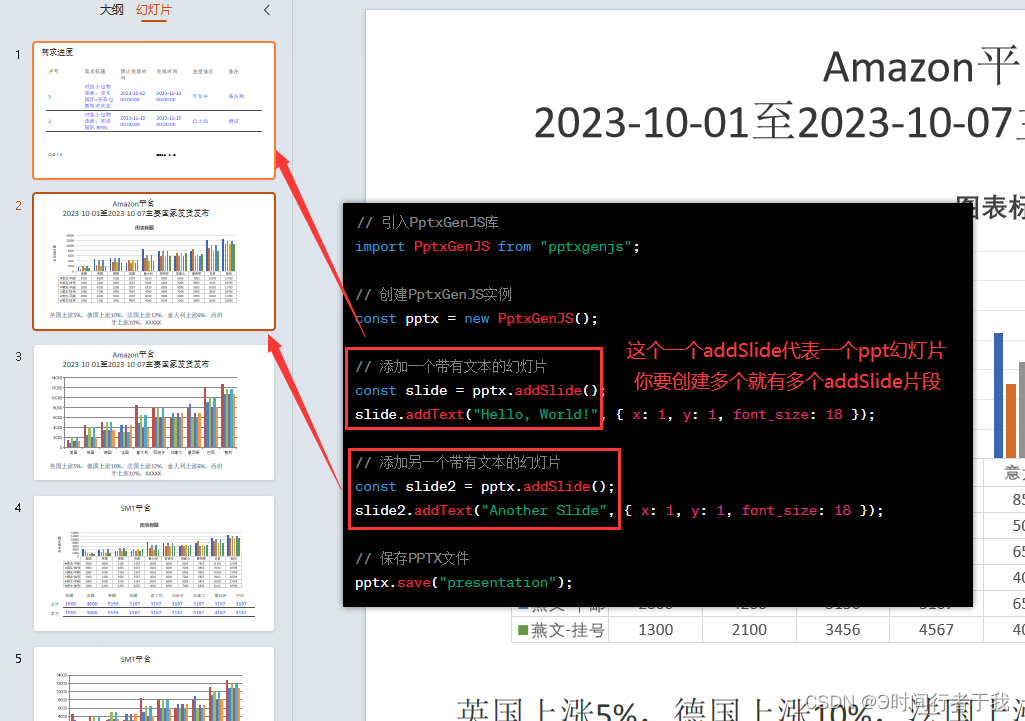
- slide 当前PPT页,可以通过addText(),addTable()等方法在当前页面添加文字、图表、图片等元素
- Text 文字,可以对ppt文字颜色、字体大小、字体阴影、背景颜色、文字位置等属性进行配置,达到自己想要的效果
- Table 表格, 可以添加ppt表格,但是表格内只能放文字和数字
- Charts 图表 图表,可以支持常见的饼状图、柱状图、折线图等,配置项也挺全的,横纵坐标,legend等啥都有,基本可以满足常用。
3.使用
js代码
exportPPT() {
// 1. 创建PPT
const pres = new Pptxgen()
// 2. 创建一个PPT页面,每调用一次 pres.addSlide() 都可以生成一张新的页面
// 建议把每个页面的构造抽成一个个函数,然后通过函数调用生成新页面,代码不会很乱
const slide = pres.addSlide()
// 3. 调用addTetx(),在PPT页面中插入文字“Hello World from PptxGenJS...”
// 括号里面是对文字的配置,文字横坐标x为1.5,纵坐标y为1.5,字体颜色 363636……
// 关于坐标长度与px的转换 x 1 = 127~128px 左右
slide.addText('需求进度', {
x: 0.2, // 横坐标
y: 0.4,
color: '363636',
fontSize: 24, // 字号
fill: { color: 'F1F1F1' },
align: 'left'
})
const rows = []
// Row One: cells will be formatted according to any options provided to `addTable()`
rows.push(['序号', '需求标题', '预计发版时间', '完成时间', '进度情况', '备注'])
const border = [ // 表格边框
{ pt: 0.5, color: '#4f4f4f' },
{ type: 'none' },
{ pt: 0.5, color: '#4f4f4f' },
{ type: 'none' }
]
const options = { valign: 'middle', border: border, color: '0000ff' } // 单元格样式配置
// Row Two: set/override formatting for each cell
rows.push([
{ text: '1', options },
{ text: '对接小包物流商:京东国际=获取包裹轨迹状态', options },
{ text: '2023-11-02 00:00:00', options },
{ text: '2023-11-12 00:00:00', options },
{ text: '开发中', options },
{ text: '备注哦', options }
], [
{ text: '2', options },
{ text: '对接小包物流商:邦递国际 BDGJ', options },
{ text: '2023-11-22 00:00:00', options },
{ text: '2023-11-15 00:00:00', options },
{ text: '已上线', options },
{ text: '测试', options }
])
slide.addTable(rows,
{
x: 0.5,
y: 1.0,
w: 9.0,
h: 3,
fontSize: 16,
colW: [0.75, 2.0, 0.85, 0.8], // 表格每一列宽度
rowH: 0.31, // 单元格默认高度
color: '363636'
}
)
// EX B: Pass the same objects as a cell's `text` value
const arrTabRows = [
[
{ text: 'Cell 1 A', options: { fontFace: 'Arial' } },
{ text: 'Cell 1 B', options: { fontFace: 'Courier' } }
]
]
slide.addTable(arrTabRows, { x: 0.5, y: 4.5, w: 9, h: 1, colW: [1.5, 1.5, 6] })
const slide2 = pres.addSlide()
// 3. 调用addTetx(),在PPT页面中插入文字“Hello World from PptxGenJS...”
// 括号里面是对文字的配置,文字横坐标x为1.5,纵坐标y为1.5,字体颜色 363636……
// 关于坐标长度与px的转换 x 1 = 127~128px 左右
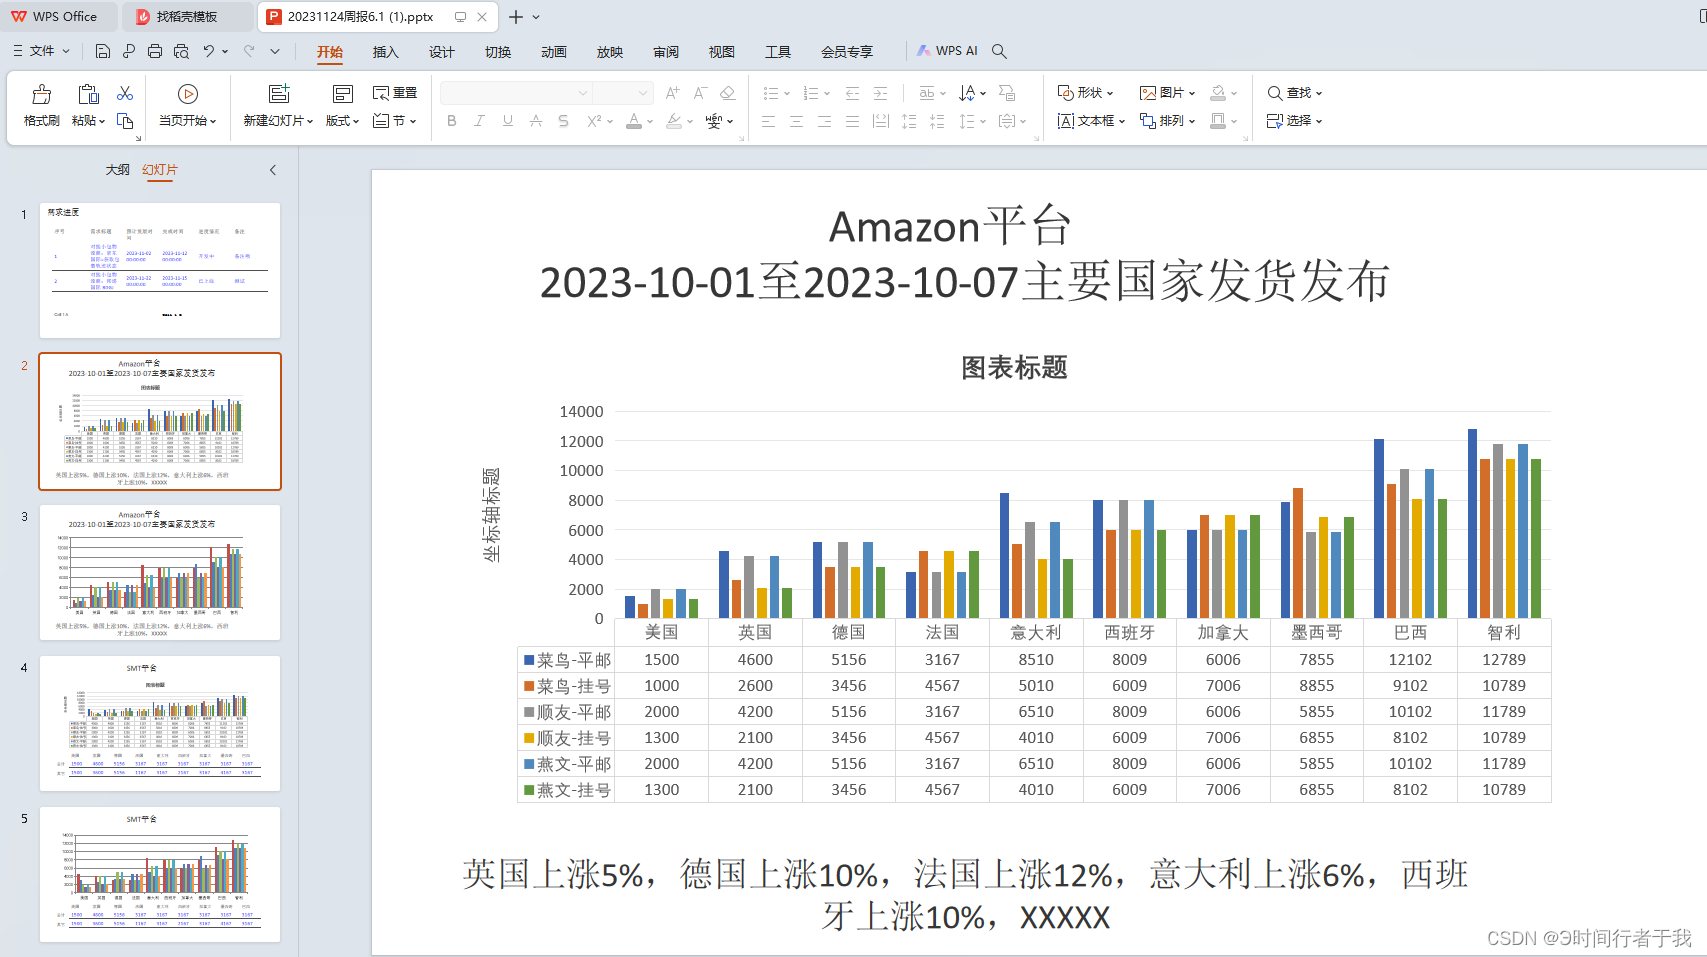
slide2.addText('Amazon平台', {
x: 0.4, // 横坐标
y: 0.4,
color: '363636',
fontSize: 24, // 字号
fill: { color: 'F1F1F1' },
align: 'center'
})
slide2.addText('2023-10-01至2023-10-07主要国家发货发布', {
x: 0.5, // 横坐标
y: 0.8,
color: '363636',
fontSize: 24, // 字号
fill: { color: 'F1F1F1' },
align: 'center'
})
// let pres = new pptxgen();
const dataChartAreaLine = [
{
name: '菜鸟-平邮',
labels: ['美国', '英国', '德国', '法国', '意大利', '西班牙', '加拿大', '墨西哥', '巴西', '智利'],
values: [1500, 4600, 5156, 3167, 8510, 8009, 6006, 7855, 12102, 12789]
},
{
name: '菜鸟-挂号',
labels: ['美国', '英国', '德国', '法国', '意大利', '西班牙', '加拿大', '墨西哥', '巴西', '智利'],
values: [1000, 2600, 3456, 4567, 5010, 6009, 7006, 8855, 9102, 10789]
},
{
name: '顺友-平邮',
labels: ['美国', '英国', '德国', '法国', '意大利', '西班牙', '加拿大', '墨西哥', '巴西', '智利'],
values: [2000, 4200, 5156, 3167, 6510, 8009, 6006, 5855, 10102, 11789]
},
{
name: '顺友-挂号',
labels: ['美国', '英国', '德国', '法国', '意大利', '西班牙', '加拿大', '墨西哥', '巴西', '智利'],
values: [1300, 2100, 3456, 4567, 4010, 6009, 7006, 6855, 8102, 10789]
},
{
name: '燕文-平邮',
labels: ['美国', '英国', '德国', '法国', '意大利', '西班牙', '加拿大', '墨西哥', '巴西', '智利'],
values: [2000, 4200, 5156, 3167, 6510, 8009, 6006, 5855, 10102, 11789]
},
{
name: '燕文-挂号',
labels: ['美国', '英国', '德国', '法国', '意大利', '西班牙', '加拿大', '墨西哥', '巴西', '智利'],
values: [1300, 2100, 3456, 4567, 4010, 6009, 7006, 6855, 8102, 10789]
}
]
slide2.addChart(pres.ChartType.bar, dataChartAreaLine,
{
x: 0.6,
y: 1.2,
w: 8,
h: 3.5,
title: 'Amazon平台' // 标题
}
)
const tempResult3 = '英国上涨5%,德国上涨10%,法国上涨12%,意大利上涨6%,西班牙上涨10%,XXXXX'
slide2.addText(tempResult3, {
x: 0.5, // 横坐标
y: 5.2,
color: '363636',
fontSize: 18, // 字号
fill: { color: 'F1F1F1' },
align: 'center'
})
const slide3 = pres.addSlide()
// 3. 调用addTetx(),在PPT页面中插入文字“Hello World from PptxGenJS...”
// 括号里面是对文字的配置,文字横坐标x为1.5,纵坐标y为1.5,字体颜色 363636……
// 关于坐标长度与px的转换 x 1 = 127~128px 左右
slide3.addText('SMT平台', {
x: 0.5, // 横坐标
y: 0.5,
color: '363636',
fontSize: 24, // 字号
fill: { color: 'F1F1F1' },
align: 'center'
})
// let pres = new pptxgen();
const dataChartAreaLine3 = [
{
name: '菜鸟-平邮',
labels: ['美国', '英国', '德国', '法国', '意大利', '西班牙', '加拿大', '墨西哥', '巴西', '智利'],
values: [4500, 4000, 3156, 3167, 8510, 8009, 6006, 7855, 11102, 12789]
},
{
name: '菜鸟-挂号',
labels: ['美国', '英国', '德国', '法国', '意大利', '西班牙', '加拿大', '墨西哥', '巴西', '智利'],
values: [3000, 2600, 3456, 4567, 5010, 6009, 7006, 8855, 9102, 10789]
},
{
name: '顺友-平邮',
labels: ['美国', '英国', '德国', '法国', '意大利', '西班牙', '加拿大', '墨西哥', '巴西', '智利'],
values: [2000, 4200, 5156, 3167, 6510, 8009, 6006, 5855, 10102, 11789]
},
{
name: '顺友-挂号',
labels: ['美国', '英国', '德国', '法国', '意大利', '西班牙', '加拿大', '墨西哥', '巴西', '智利'],
values: [1300, 2100, 3456, 4567, 4010, 6009, 7006, 6855, 8102, 10789]
},
{
name: '燕文-平邮',
labels: ['美国', '英国', '德国', '法国', '意大利', '西班牙', '加拿大', '墨西哥', '巴西', '智利'],
values: [2000, 4200, 5156, 3167, 6510, 8009, 6006, 5855, 10102, 11789]
},
{
name: '燕文-挂号',
labels: ['美国', '英国', '德国', '法国', '意大利', '西班牙', '加拿大', '墨西哥', '巴西', '智利'],
values: [1300, 2100, 3456, 4567, 4010, 6009, 7006, 6855, 8102, 10789]
}
]
slide3.addChart(pres.ChartType.bar, dataChartAreaLine3,
{ x: 0.8, y: 1, w: 8, h: 3 }
)
const rows3 = []
// Row One: cells will be formatted according to any options provided to `addTable()`
rows3.push(['美国', '英国', '德国', '法国', '意大利', '西班牙', '加拿大', '墨西哥', '巴西'])
// const border3 = [ // 表格边框
// { pt: 0.5, color: '#4f4f4f' },
// { type: 'none' },
// { pt: 0.5, color: '#4f4f4f' },
// { type: 'none' }
// ]
// const options = { valign: 'middle', border: border3, color: '0000ff' } // 单元格样式配置
// Row Two: set/override formatting for each cell
// options 这个options是上面公用的,如果不共用,单独拉一个
rows3.push([
{ text: '1500', options },
{ text: '4600', options },
{ text: '5156', options },
{ text: '3167', options },
{ text: '3167', options },
{ text: '3167', options },
{ text: '3167', options },
{ text: '3167', options },
{ text: '3167', options }
], [
{ text: '1500', options },
{ text: '3600', options },
{ text: '5156', options },
{ text: '1167', options },
{ text: '3167', options },
{ text: '2167', options },
{ text: '3167', options },
{ text: '4167', options },
{ text: '3167', options }
])
slide3.addTable(rows3,
{
x: 1.2,
y: 4,
w: 8.0,
h: 1.5,
fontSize: 12,
colW: [0.75, 2.0, 0.85, 0.8], // 表格每一列宽度
rowH: 0.25, // 单元格默认高度
color: '363636'
}
)
slide3.addText('总计', {
x: 0.6, // 横坐标
y: 4.5,
color: '363636',
fontSize: 12, // 字号
fill: { color: 'F1F1F1' },
align: 'left'
})
slide3.addText('其它', {
x: 0.6, // 横坐标
y: 4.9,
color: '363636',
fontSize: 12, // 字号
fill: { color: 'F1F1F1' },
align: 'left'
})
pres.author = '作者_abin'
pres.company = '公司'
// 4. 生成PPT, 括号中的fileName,就是生成的 PPT名字,可以使用 .then 或者 .catch处理对应事件。
pres.writeFile({ fileName: '20231124周报6.2.pptx' }).then(() => {
this.$Message.success('导出成功')
})
},
原文地址:https://blog.csdn.net/qq_45094682/article/details/134600787
本文来自互联网用户投稿,该文观点仅代表作者本人,不代表本站立场。本站仅提供信息存储空间服务,不拥有所有权,不承担相关法律责任。
如若转载,请注明出处:http://www.7code.cn/show_203.html
如若内容造成侵权/违法违规/事实不符,请联系代码007邮箱:suwngjj01@126.com进行投诉反馈,一经查实,立即删除!
声明:本站所有文章,如无特殊说明或标注,均为本站原创发布。任何个人或组织,在未征得本站同意时,禁止复制、盗用、采集、发布本站内容到任何网站、书籍等各类媒体平台。如若本站内容侵犯了原著者的合法权益,可联系我们进行处理。