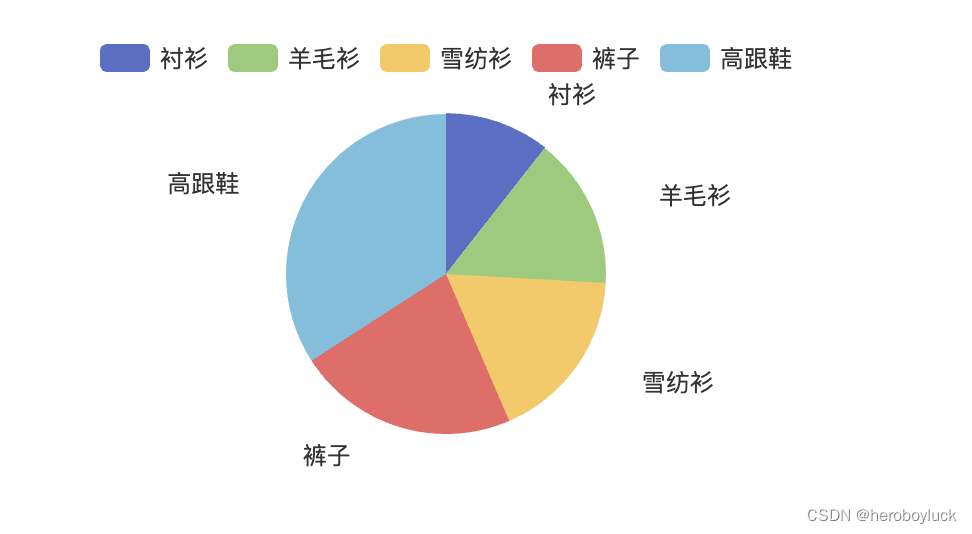
legend 图例组件展示不同系列的图表类型标记、颜色、和名称。可以通过点击来控制哪个系列不展示。对于饼图来说,控制哪个数据不展示。
$> echarts@5.4.0
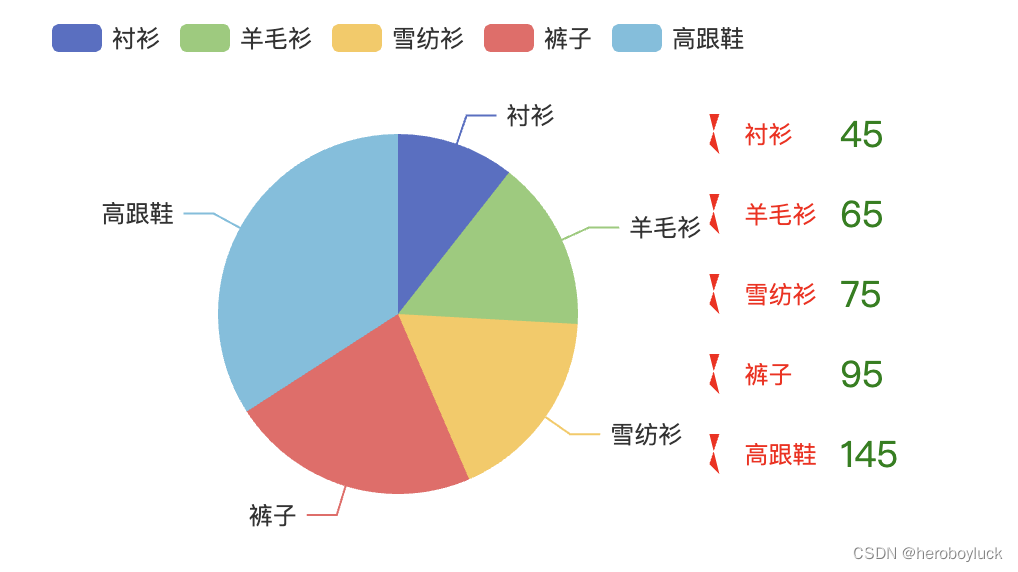
简单画一个饼图作为示例,设置legend:{show:true}展示图例。
const options = {
  legend: {
    show: true,
  },
  series: [
    {
      name: "销量",
      type: "pie",
      center: ["50%", "30%"],
      radius: "40%",
      data: [
        {
          value: 45,
          name: "衬衫",
        },
        {
          value: 65,
          name: "羊毛衫",
        },
        {
          value: 75,
          name: "雪纺衫",
        },
        {
          value: 95,
          name: "裤子",
        },
        {
          value: 145,
          name: "高跟鞋",
        },
      ],
    },
  ],
};
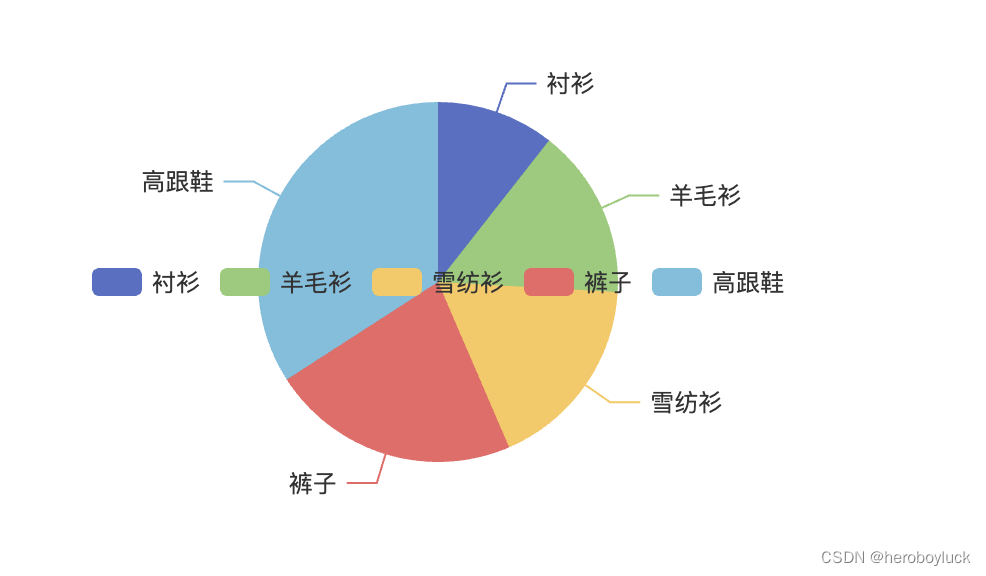
通过lefttoprightbottom来调整图例的位置
const options = {
  legend: {
    show: true,
    bottom: 0,
  },
  // ...
};
而对于left还可以设置为leftcenterright;top可以设置为topmiddlebottom
const options = {
  legend: {
    show: true,
    left: "center",
    top: "middle",
  },
  // ...
};
orient 用来设置图例的朝向
默认方向为水平horizontal。可以设置垂直方向vertical,设置left:right让它置于右侧
const options = {
  legend: {
    show: true,
    left: "right",
    top: "middle",
    orient: "vertical",
  },
  //...
};
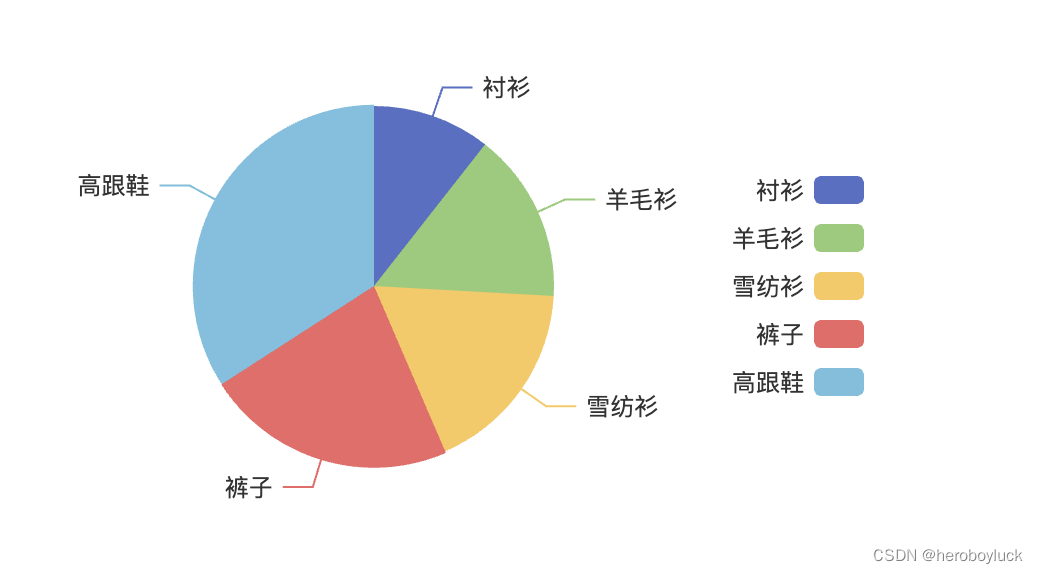
可以看到图例在右侧了,标记图形和文本方式是默认对齐,也会由组件的位置和orient决定,即left:right和orient: vertical时,图例会在右侧
也可以通过align设置对齐方式,可选值为autoleftright
const options = {
  legend: {
    show: true,
    left: "right",
    top: "middle",
    orient: "vertical",
    align: "left",
  },
  // ...
};
itemWidthitemHeight设置图例图形的大小
默认的图形大小itemWidth:25,itemHeight:14,长方形。设置为正方形展示
const options = {
  legend: {
    show: true,
    // ...
    itemWidth: 10,
    itemHeight: 10,
  },
  // ...
};
const options = {
  legend: {
    show: true,
    // ...
    itemWidth: 10,
    itemHeight: 10,
    itemGap: 20,
  },
  // ...
};
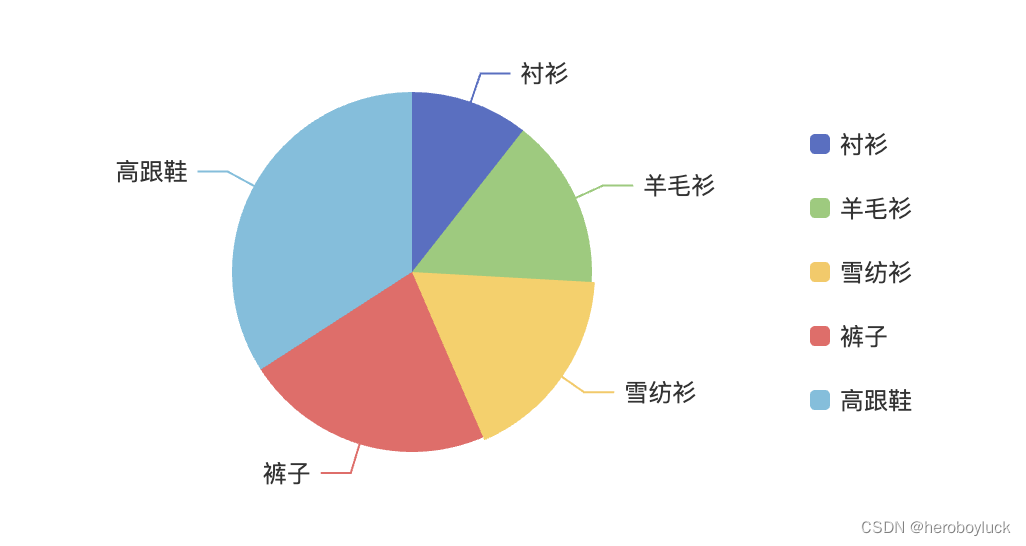
通过icon设置图形的类型,默认为roundRect,可选值
circlerectroundRecttrianglediamondpinarrownone– 圆、矩形、圆角矩形、三角形、菱形、水滴形、箭头image://${url}设置为图片,可以是图片路径,也可以是 dataURIbase64path://设置任意矢量路径
const options = {
  legend: {
    show: true,
    // ...
    itemWidth: 20,
    itemHeight: 20,
    itemGap: 20,
    icon: "path://M 200 100 L 300 100 L 200 400 L 300 500 z",
  },
  // ...
};
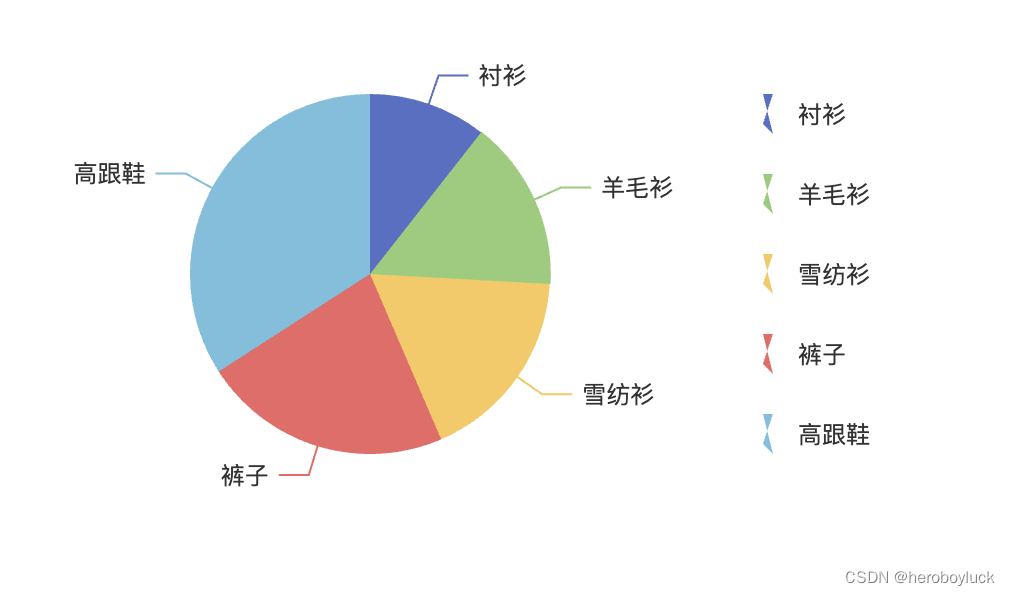
可以通过itemStyle设置图形样式,一般不会设置,默认继承系列里的样式。
可以设置颜色color、边框border、阴影shandow等。
const options = {
  legend: {
    show: true,
    // ...
    itemWidth: 20,
    itemHeight: 20,
    itemGap: 20,
    icon: "path://M 200 100 L 300 100 L 200 400 L 300 500 z",
    itemStyle: {
      color: "red",
    },
  },
  // ...
};
当自定义图例图形时,一些图形的样式设置不会影响到自定义图形。
formatter来格式化图例文本
格式化图例文本,可以通过字符串模板和回调函数处理。都只有一个变量name可供使用
const options = {
  legend: {
    show: true,
    // ...
    formatter: "hello {name}",
  },
  // ...
};
回调函数可以通过查找name的方式,找到数据项,渲染数值或其他内容.
const options = {
  legend: {
    show: true,
    // ...
    formatter(name) {
      let info = $this.data.find((item) => item.name == name);

      return `${name}r${info.value}`;
    },
  },
  // ...
};
通过textStyle文本样式,包括颜色、字体、文本块边框、文本块阴影、文字块背景色、文本描边、文本阴影。
const options = {
  legend: {
    show: true,
    // ...
    formatter(name) {
      let info = $this.data.find((item) => item.name == name);

      return `${name}r${info.value}`;
    },
    textStyle: {
      color: "green",
      borderWidth: 1,
      borderColor: "#000",
      textBorderWidth: 2,
      textBorderColor: "red",
    },
  },
  // ...
};
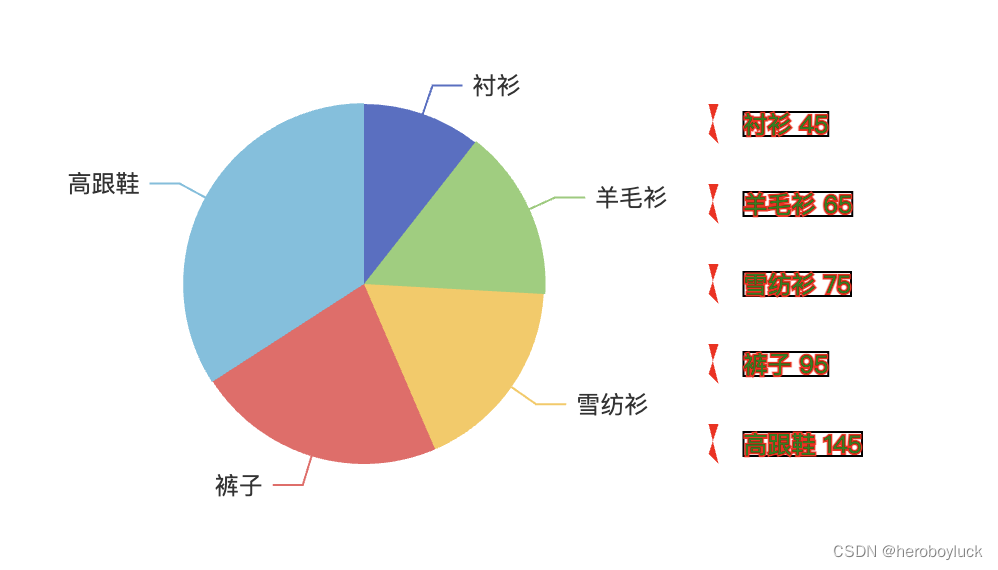
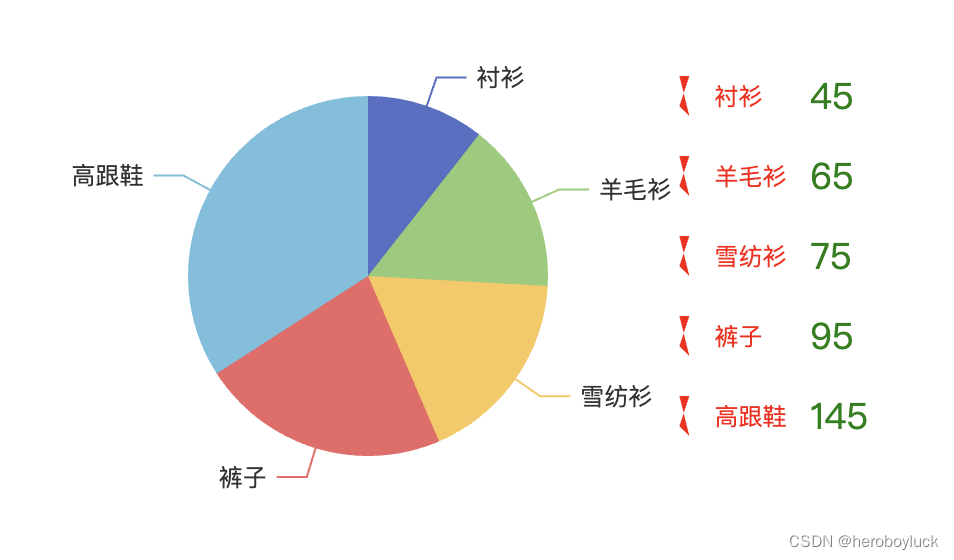
通过rich属性,自定义富文本样式,可以设置分割文字块设置不同的样式。
const options = {
  legend: {
    show: true,
    // ...
    formatter(name) {
      let info = $this.data.find((item) => item.name == name);

      return `{name|${name}}r {value|${info.value}}`;
    },
    textStyle: {
      width: 300,
      rich: {
        name: {
          color: "red",
        },
        value: {
          color: "green",
          fontSize: 18,
        },
      },
    },
  },
  // ...
};
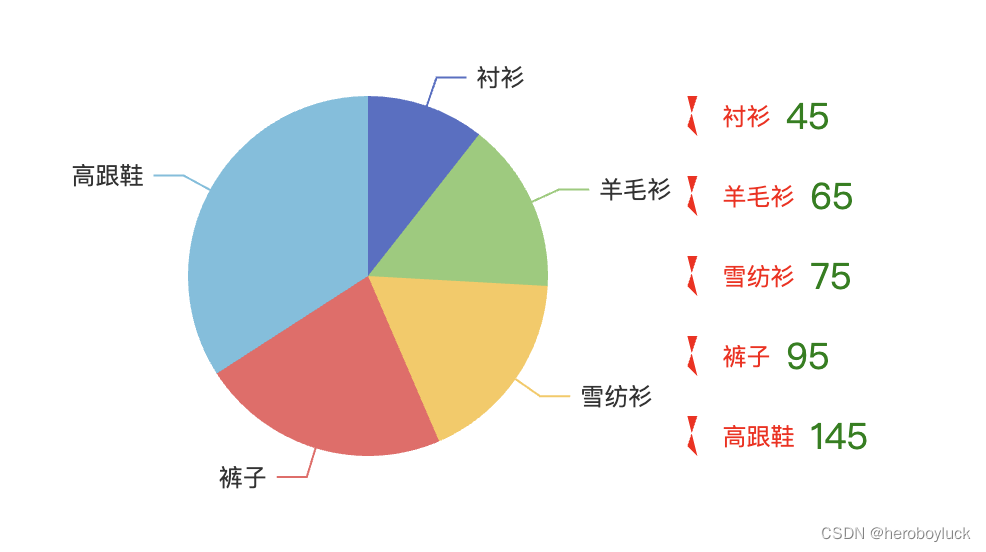
对于 rich 富文本,可以设置每一块文字的宽度,不生效时注意版本,可以设置textStyle.width尝试。
const options = {
  legend: {
    show: true,
    // ...
    formatter(name) {
      let info = $this.data.find((item) => item.name == name);

      return `{name|${name}}r {value|${info.value}}`;
    },
    textStyle: {
      width: 300,
      rich: {
        name: {
          color: "red",
          width: 50,
        },
        value: {
          color: "green",
          fontSize: 18,
        },
      },
    },
  },
  // ...
};
data定义图例数据
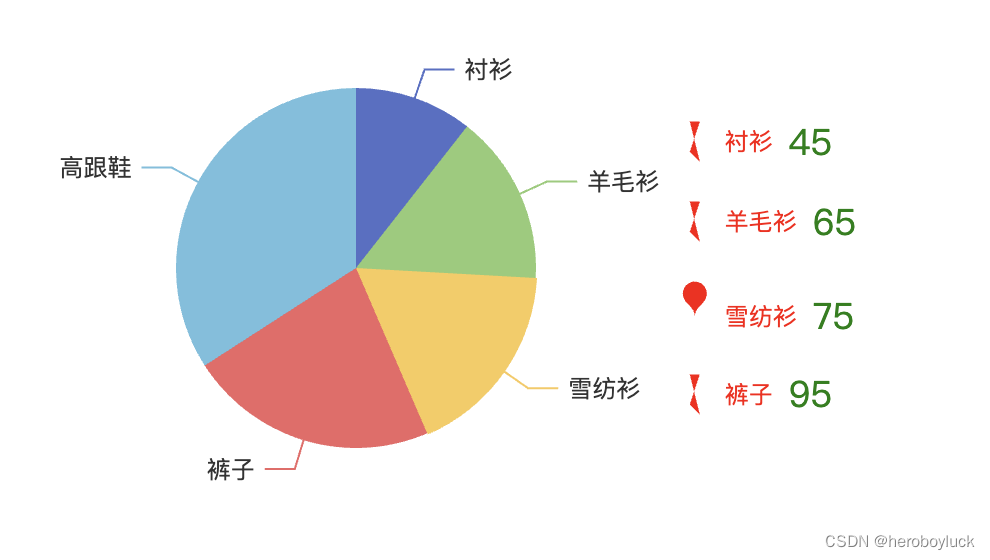
默认的图例数据会从系列中获取,如果需要设置不同的图例样式或者不需要展示某个系列图例则可设置数据。
图例的数据字段name必须是系列中的系列名称或数据名,测试不展示最后一项高跟鞋.并设置数据名为雪纺衫的图例图形为pin
const options = {
  legend: {
    show: true,
    // ...
    data: [
      {
        name: "衬衫",
      },
      {
        name: "羊毛衫",
      },
      {
        name: "雪纺衫",
        icon: "pin",
      },
      {
        name: "裤子",
      },
    ],
  },
  // ...
};
type:scroll设置滚动翻页的图例
图例比较多时,可能就放不下了,除了控制展示图例数。可以设置滚动图例,增加数据超过图表高度。
const options = {
  legend: {
    type: "scroll",
    show: true,
    left: "right",
    top: 50,
    height: "60%",
    orient: "vertical",
    // ...
  },
};
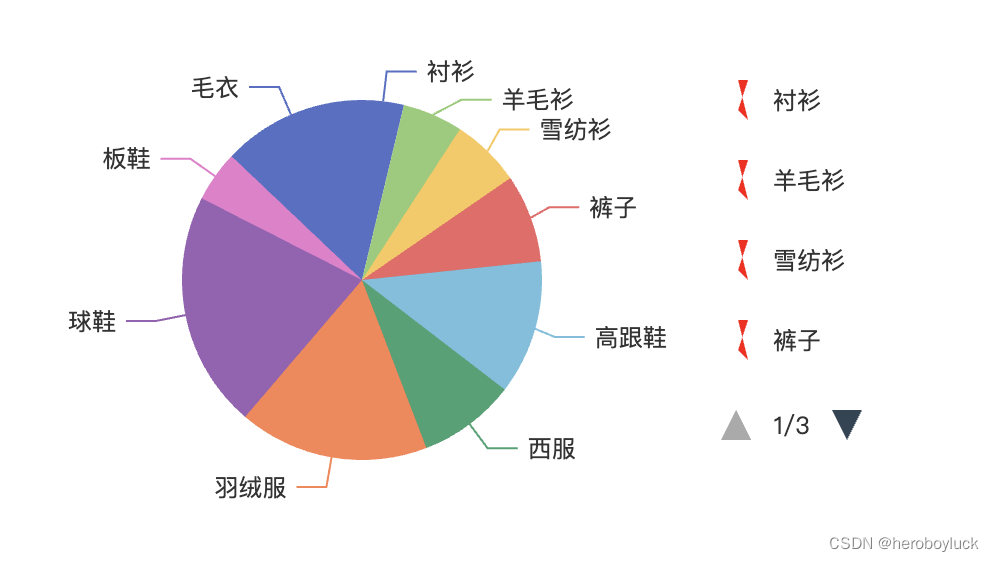
通过设置属性top: 50, height: "60%",调整图例的位置。
通过以下属性控制图例的样式,包括翻页按钮位置、翻页信息数据格式、翻页图标、翻页信息文字样式
配置tooltip显示图例文本
tooltip配置同全局的 tooltip 配置项。设置属性show: true,展示图例文本的 tooltip 提示。
const options = {
  legend: {
    show: true,
    // ...
    tooltip: {
      show: true,
    },
  },
  tooltip: {
    show: true,
  },
};
受全局tooltip配置属性影响,全局 tooltip 必须配置为show:true。图例中的 tooltip 才会生效。
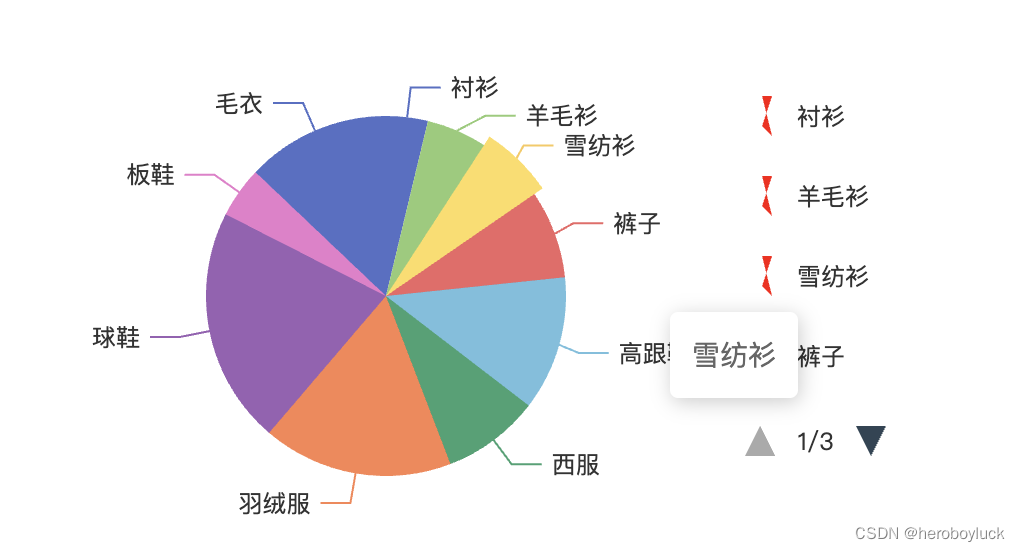
针对图例文本过长时,做配置截断处理。然后通过tooltip展示所有内容,设置 textStylewidth文本宽度,超出后样式overflow: "truncate"
const options = {
  legend: {
    show: true,
    // ...
    tooltip: {
      show: true,
    },
    textStyle: {
      width: 80,
      overflow: "truncate",
    },
  },
  tooltip: {
    show: true,
    confine: true,
  },
};
为了防止 tooltip 超出图表被遮挡,可以设置confine:true将 tooltip 限制在图表内。
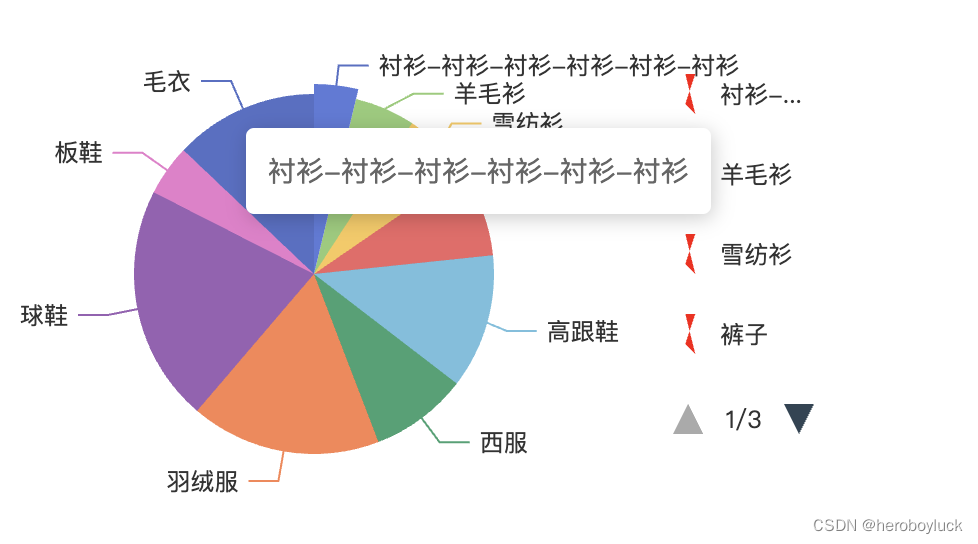
也可以通过formatter格式化文本,手动截断文本。echarts.format.truncateText()方法可以裁剪文本,参数:包括文本、内容宽度、字体样式、省略符内容、文本样式配置
function truncateText(text, containerWidth, font, ellipsis, options) {
  if (!containerWidth) {
    return "";
  }
  var textLines = (text + "").split("n");
  options = prepareTruncateOptions(containerWidth, font, ellipsis, options);
  for (var i = 0, len = textLines.length; i < len; i++) {
    textLines[i] = truncateSingleLine(textLines[i], options);
  }
  return textLines.join("n");
}
多个图例legend配置
const options = {
  legend: [
    { show: true },
    {
      show: true,
      // ...
    },
  ],
};
这样当图例很多时,又不想要滚动,就可以使用多个图例方式,放置不同的位置。通过legend.data分配每一个图例要展示的数据
const options = {
  legend: [
    {
      show: true,
      left: "left",
      top: 50,
      height: "60%",
      orient: "vertical",
      align: "right",
      // ...
    },
    {
      show: true,
      left: "right",
      top: 50,
      height: "60%",
      orient: "vertical",
      align: "left",
      // ...
    },
  ],
};
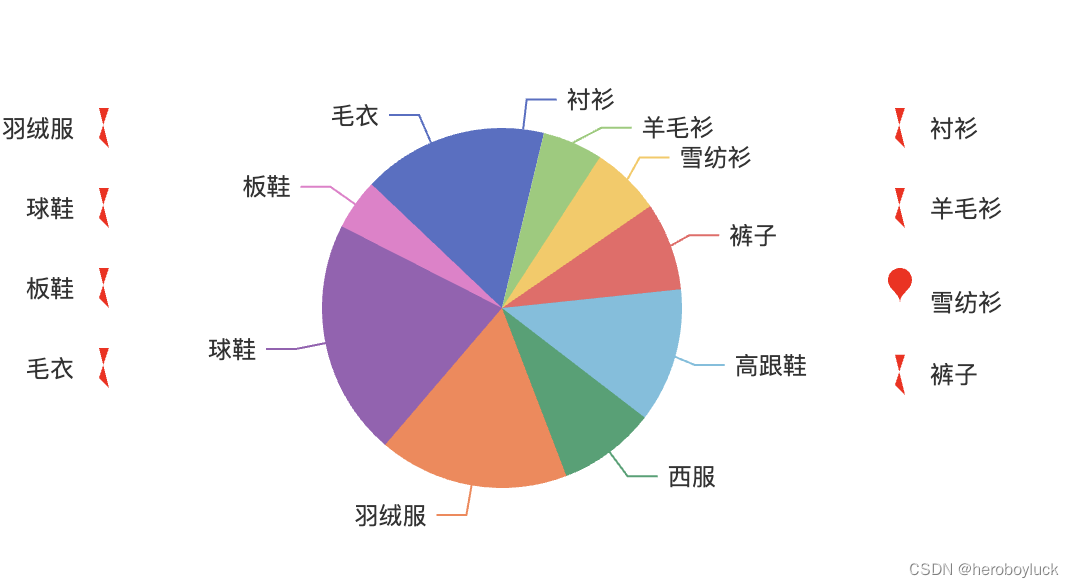
主要是为了做一个引导说明,通过legend可以实现哪些功能,详细查看文档配置。
Echarts – legend
原文地址:https://blog.csdn.net/heroboyluck/article/details/132125440
本文来自互联网用户投稿,该文观点仅代表作者本人,不代表本站立场。本站仅提供信息存储空间服务,不拥有所有权,不承担相关法律责任。
如若转载,请注明出处:http://www.7code.cn/show_21182.html
如若内容造成侵权/违法违规/事实不符,请联系代码007邮箱:suwngjj01@126.com进行投诉反馈,一经查实,立即删除!

![[office] excel2010双向条形图制作 #经验分享#微信](https://img-blog.csdnimg.cn/img_convert/0082b56b61dd88eeb67a1bf166913985.jpeg)


