一、下载依赖
1.1、获取mpvue–echarts组件
可以先随便建个文件夹,然后 npm init。运行下面的命令行,下载依赖
npm install echarts mpvue-echarts
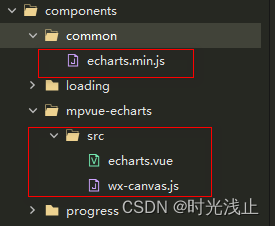
找到node_modulesmpvue–echarts下的文件,保留src文件夹,其他删除,复制mpvue–echarts文件夹到项目的components中
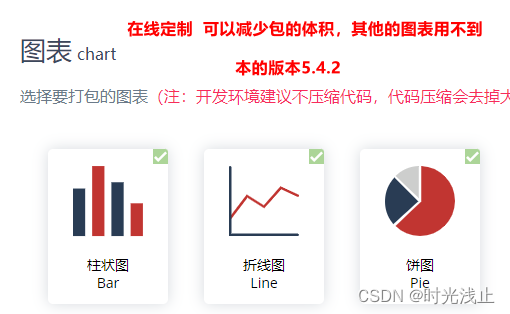
1.2、获取定制echarts的js文件
在https://echarts.apache.org/zh/builder.html定制echarts的js文件,然后下载,放到common目录下
echarts.vue代码 在原来的基础上修改了不然微信小程序报错
<template>
<canvas
v-if="canvasId"
class="ec-canvas"
:id="canvasId"
:canvasId="canvasId"
@touchstart="touchStart"
@touchmove="touchMove"
@touchend="touchEnd"
@error="error">
</canvas>
</template>
<script>
import WxCanvas from './wx-canvas';
import * as echarts from "@/components/common/echarts.min.js";
function wrapTouch(e) {
for (let i = 0; i < e.mp.touches.length; i += 1) {
const touch = e.mp.touches[i];
touch.offsetX = touch.x;
touch.offsetY = touch.y;
}
return e;
}
export default {
props: {
// echarts: {
// required: true,
// type: Object,
// default() {
// return null;
// },
// },
onInit: {
type: Function,
default: null,
},
canvasId: {
type: String,
default: 'ec-canvas',
},
lazyLoad: {
type: Boolean,
default: false,
},
disableTouch: {
type: Boolean,
default: false,
},
throttleTouch: {
type: Boolean,
default: false,
},
},
onReady() {
this.echarts=echarts
if (!this.echarts) {
console.warn('组件需绑定 echarts 变量,例:<ec-canvas id="mychart-dom-bar" '
+ 'canvas-id="mychart-bar" :echarts="echarts"></ec-canvas>');
return;
}
if (!this.lazyLoad) this.init();
},
methods: {
init(callback) {
const version = wx.version.version.split('.').map(n => parseInt(n, 10));
const isValid = version[0] > 1 || (version[0] === 1 && version[1] > 9)
|| (version[0] === 1 && version[1] === 9 && version[2] >= 91);
if (!isValid) {
console.error('微信基础库版本过低,需大于等于 1.9.91。'
+ '参见:https://github.com/ecomfe/echarts-for-weixin'
+ '#%E5%BE%AE%E4%BF%A1%E7%89%88%E6%9C%AC%E8%A6%81%E6%B1%82');
return;
}
// const { canvasId } = this;
// this.ctx = wx.createCanvasContext(canvasId);
const canvasId=this.canvasId;//-----修改------
this.ctx=wx.createCanvasContext(canvasId,this);//-----修改------
const canvas = new WxCanvas(this.ctx, canvasId);
this.echarts.setCanvasCreator(() => canvas);
// const query = wx.createSelectorQuery();
const query=wx.createSelectorQuery().in(this);//-----修改------
query.select(`#${canvasId}`).boundingClientRect((res) => {
if (!res) {
setTimeout(() => this.init(), 50);
return;
}
const { width, height } = res;
if (typeof callback === 'function') {
this.chart = callback(canvas, width, height);
} else if (typeof this.onInit === 'function') {
this.chart = this.onInit(canvas, width, height);
}
if (!this.chart) {
return;
}
const { handler } = this.chart.getZr();
this.handler = handler;
this.processGesture = handler.proxy.processGesture || (() => {});
}).exec();
},
canvasToTempFilePath(opt) {
const { canvasId } = this;
this.ctx.draw(true, () => {
wx.canvasToTempFilePath({
canvasId,
...opt,
});
});
},
touchStart(e) {
const { disableTouch, chart } = this;
if (disableTouch || !chart || !e.mp.touches.length) return;
const touch = e.mp.touches[0];
this.handler.dispatch('mousedown', {
zrX: touch.x,
zrY: touch.y,
});
this.handler.dispatch('mousemove', {
zrX: touch.x,
zrY: touch.y,
});
this.processGesture(wrapTouch(e), 'start');
},
touchMove(e) {
const {
disableTouch, throttleTouch, chart, lastMoveTime,
} = this;
if (disableTouch || !chart || !e.mp.touches.length) return;
if (throttleTouch) {
const currMoveTime = Date.now();
if (currMoveTime - lastMoveTime < 240) return;
this.lastMoveTime = currMoveTime;
}
const touch = e.mp.touches[0];
this.handler.dispatch('mousemove', {
zrX: touch.x,
zrY: touch.y,
});
this.processGesture(wrapTouch(e), 'change');
},
touchEnd(e) {
const { disableTouch, chart } = this;
if (disableTouch || !chart) return;
const touch = e.mp.changedTouches ? e.mp.changedTouches[0] : {};
this.handler.dispatch('mouseup', {
zrX: touch.x,
zrY: touch.y,
});
this.handler.dispatch('click', {
zrX: touch.x,
zrY: touch.y,
});
this.processGesture(wrapTouch(e), 'end');
},
},
};
</script>
<style scoped>
.ec-canvas {
width: 100%;
height: 100%;
}
</style>
wx-canvas.js代码 在原来的基础上修改了不然微信小程序报错
export default class WxCanvas {
  constructor(ctx, canvasId) {
    this.ctx = ctx;
    this.canvasId = canvasId;
    this.chart = null;

    WxCanvas.initStyle(ctx);
    this.initEvent();
  }
// 新增空函数,修复调用 echarts.init 时报错
  addEventListener() {}

  getContext(contextType) {
    return contextType === '2d' ? this.ctx : null;
  }

  setChart(chart) {
    this.chart = chart;
  }

  attachEvent() {
    // noop
  }

  detachEvent() {
    // noop
  }

  static initStyle(ctx) {
    const styles = ['fillStyle', 'strokeStyle', 'globalAlpha',
      'textAlign', 'textBaseAlign', 'shadow', 'lineWidth',
      'lineCap', 'lineJoin', 'lineDash', 'miterLimit', 'fontSize'];

    styles.forEach((style) => {
      Object.defineProperty(ctx, style, {
        set: (value) => {
          if ((style !== 'fillStyle' && style !== 'strokeStyle')
            || (value !== 'none' && value !== null)
          ) {
            ctx[`set${style.charAt(0).toUpperCase()}${style.slice(1)}`](value);
          }
        },
      });
    });

    ctx.createRadialGradient = () => ctx.createCircularGradient(arguments);
  }

  initEvent() {
    this.event = {};
    const eventNames = [{
      wxName: 'touchStart',
      ecName: 'mousedown',
    }, {
      wxName: 'touchMove',
      ecName: 'mousemove',
    }, {
      wxName: 'touchEnd',
      ecName: 'mouseup',
    }, {
      wxName: 'touchEnd',
      ecName: 'click',
    }];

    eventNames.forEach((name) => {
      this.event[name.wxName] = (e) => {
        const touch = e.mp.touches[0];
        this.chart.getZr().handler.dispatch(name.ecName, {
          zrX: name.wxName === 'tap' ? touch.clientX : touch.x,
          zrY: name.wxName === 'tap' ? touch.clientY : touch.y,
        });
      };
    });
  }
}
二、页面运用
<template>
  <view class="echarts-wrap">
    <my-echarts
      id="main"
      ref="mapChart"
      :onInit="initChart"
    />
  </view>
</template>

<script>
import * as echarts from "@/components/common/echarts.min.js";  //这里根据自己存放的路径修改
import myEcharts from "@/components/mpvue-echarts/src/echarts.vue"; //这里根据自己存放的路径修改

let chart = null;  //放外层方便拿到echart实例
export default {
  components: {
    myEcharts,
  },
  data() {
    return {
      echarts,
    };
  },
  onReady() {},
  mounted() {},
  methods: {
    initChart(canvas, width, height) {
			console.log(echarts,'echarts',1)
      chart = echarts.init(canvas, null, {
        width: width,
        height: height,
      });
      canvas.setChart(chart);
			let option = {
				tooltip: {
					trigger: 'axis'
				},
				grid: {
					left: '3%',
					right: '4%',
					bottom: '5%',
					containLabel: true
				},
				xAxis: {
					name: '时间',
					type: 'category',
					data: ["Mon", "Tue", "Wed", "Thu", "Fri", "Sat", "Sun", "Tue", "Wed", "Thu", "Fri", "Sat", "Sun", "Tue", "Wed", "Thu", "Fri", "Sat", "Sun"],
				},
				yAxis: {
					show: true,
					name: '销量',
					type: 'value'
				},
				dataZoom: [{
					type: 'inside',
					filterMode: 'empty',
					startValue: 0,
					endValue: 20,
					zoomOnMouseWheel: false
				}, {
					type: 'slider'
				}],
				series: [
					  {
						data: [120, 200, 150, 80, 70, 110, 130, 200, 150, 80, 70, 110, 130, 200, 150, 80, 70, 110, 130],
						type: "line",
						itemStyle: {
						    normal: {
						        color: new echarts.graphic.LinearGradient(0, 0, 0, 1, [{
						            offset: 0,
						            color: 'rgba(0,244,255,1)' // 0% 处的颜色
						        }, {
						            offset: 1,
						            color: 'rgba(0,77,167,1)' // 100% 处的颜色
						        }], false),
						        barBorderRadius: [30, 30, 30, 30],
						        shadowColor: 'rgba(0,160,221,1)',
						        shadowBlur: 4,
						    }
						},
					  },
        ]
			}
      chart.setOption(option);

      return chart; // 返回 chart 后可以自动绑定触摸操作
    },
    updateData(){
				console.log(echarts,'echarts',2)
        setTimeout(()=>{
            chart.setOption({
                series:[{
                    data:[30, 90, 111, 20, 70, 88, 11]
                }]
            })
        },1000)
    },
  },
};
</script>

<style>
.echarts-wrap {
  width: 100%;
  height: 300px;
}
</style>
原文地址:https://blog.csdn.net/weixin_45086164/article/details/131762052
本文来自互联网用户投稿,该文观点仅代表作者本人,不代表本站立场。本站仅提供信息存储空间服务,不拥有所有权,不承担相关法律责任。
如若转载,请注明出处:http://www.7code.cn/show_21812.html
如若内容造成侵权/违法违规/事实不符,请联系代码007邮箱:suwngjj01@126.com进行投诉反馈,一经查实,立即删除!
主题授权提示:请在后台主题设置-主题授权-激活主题的正版授权,授权购买:RiTheme官网
声明:本站所有文章,如无特殊说明或标注,均为本站原创发布。任何个人或组织,在未征得本站同意时,禁止复制、盗用、采集、发布本站内容到任何网站、书籍等各类媒体平台。如若本站内容侵犯了原著者的合法权益,可联系我们进行处理。