本期开始案例较为硬核起来了,适合理工科的硕士,人文社科的同学可以看前面的案例。
案例背景
这篇文章是去年就发了,刊物也印刷了,现在分享一部分代码作为案例给需要的同学。
锂离子电池剩余使用寿命(RUL)是电池健康管理的一个重要指标。本文采用电池容量作为健康状况的指标,使用模态分解和机器学习算法,提出了一种CEEMDAN-RF-SED-LSTM方法去预测锂电池RUL。
首先采用CEEMDAN分解电池容量数据,为了避免波动分量里的噪音对模型预测能力的影响,且又不完全抛弃波动分量里的特征信息,本工作提出使用随机森林(RF)算法得到每个波动分量的重要性排序和数值,以此作为每个分量对原始数据解释能力的权重。然后将权重值和不同波动分量构建的神经网络模型得到的预测结果进行加权重构,进而得到锂离子电池的RUL预测。
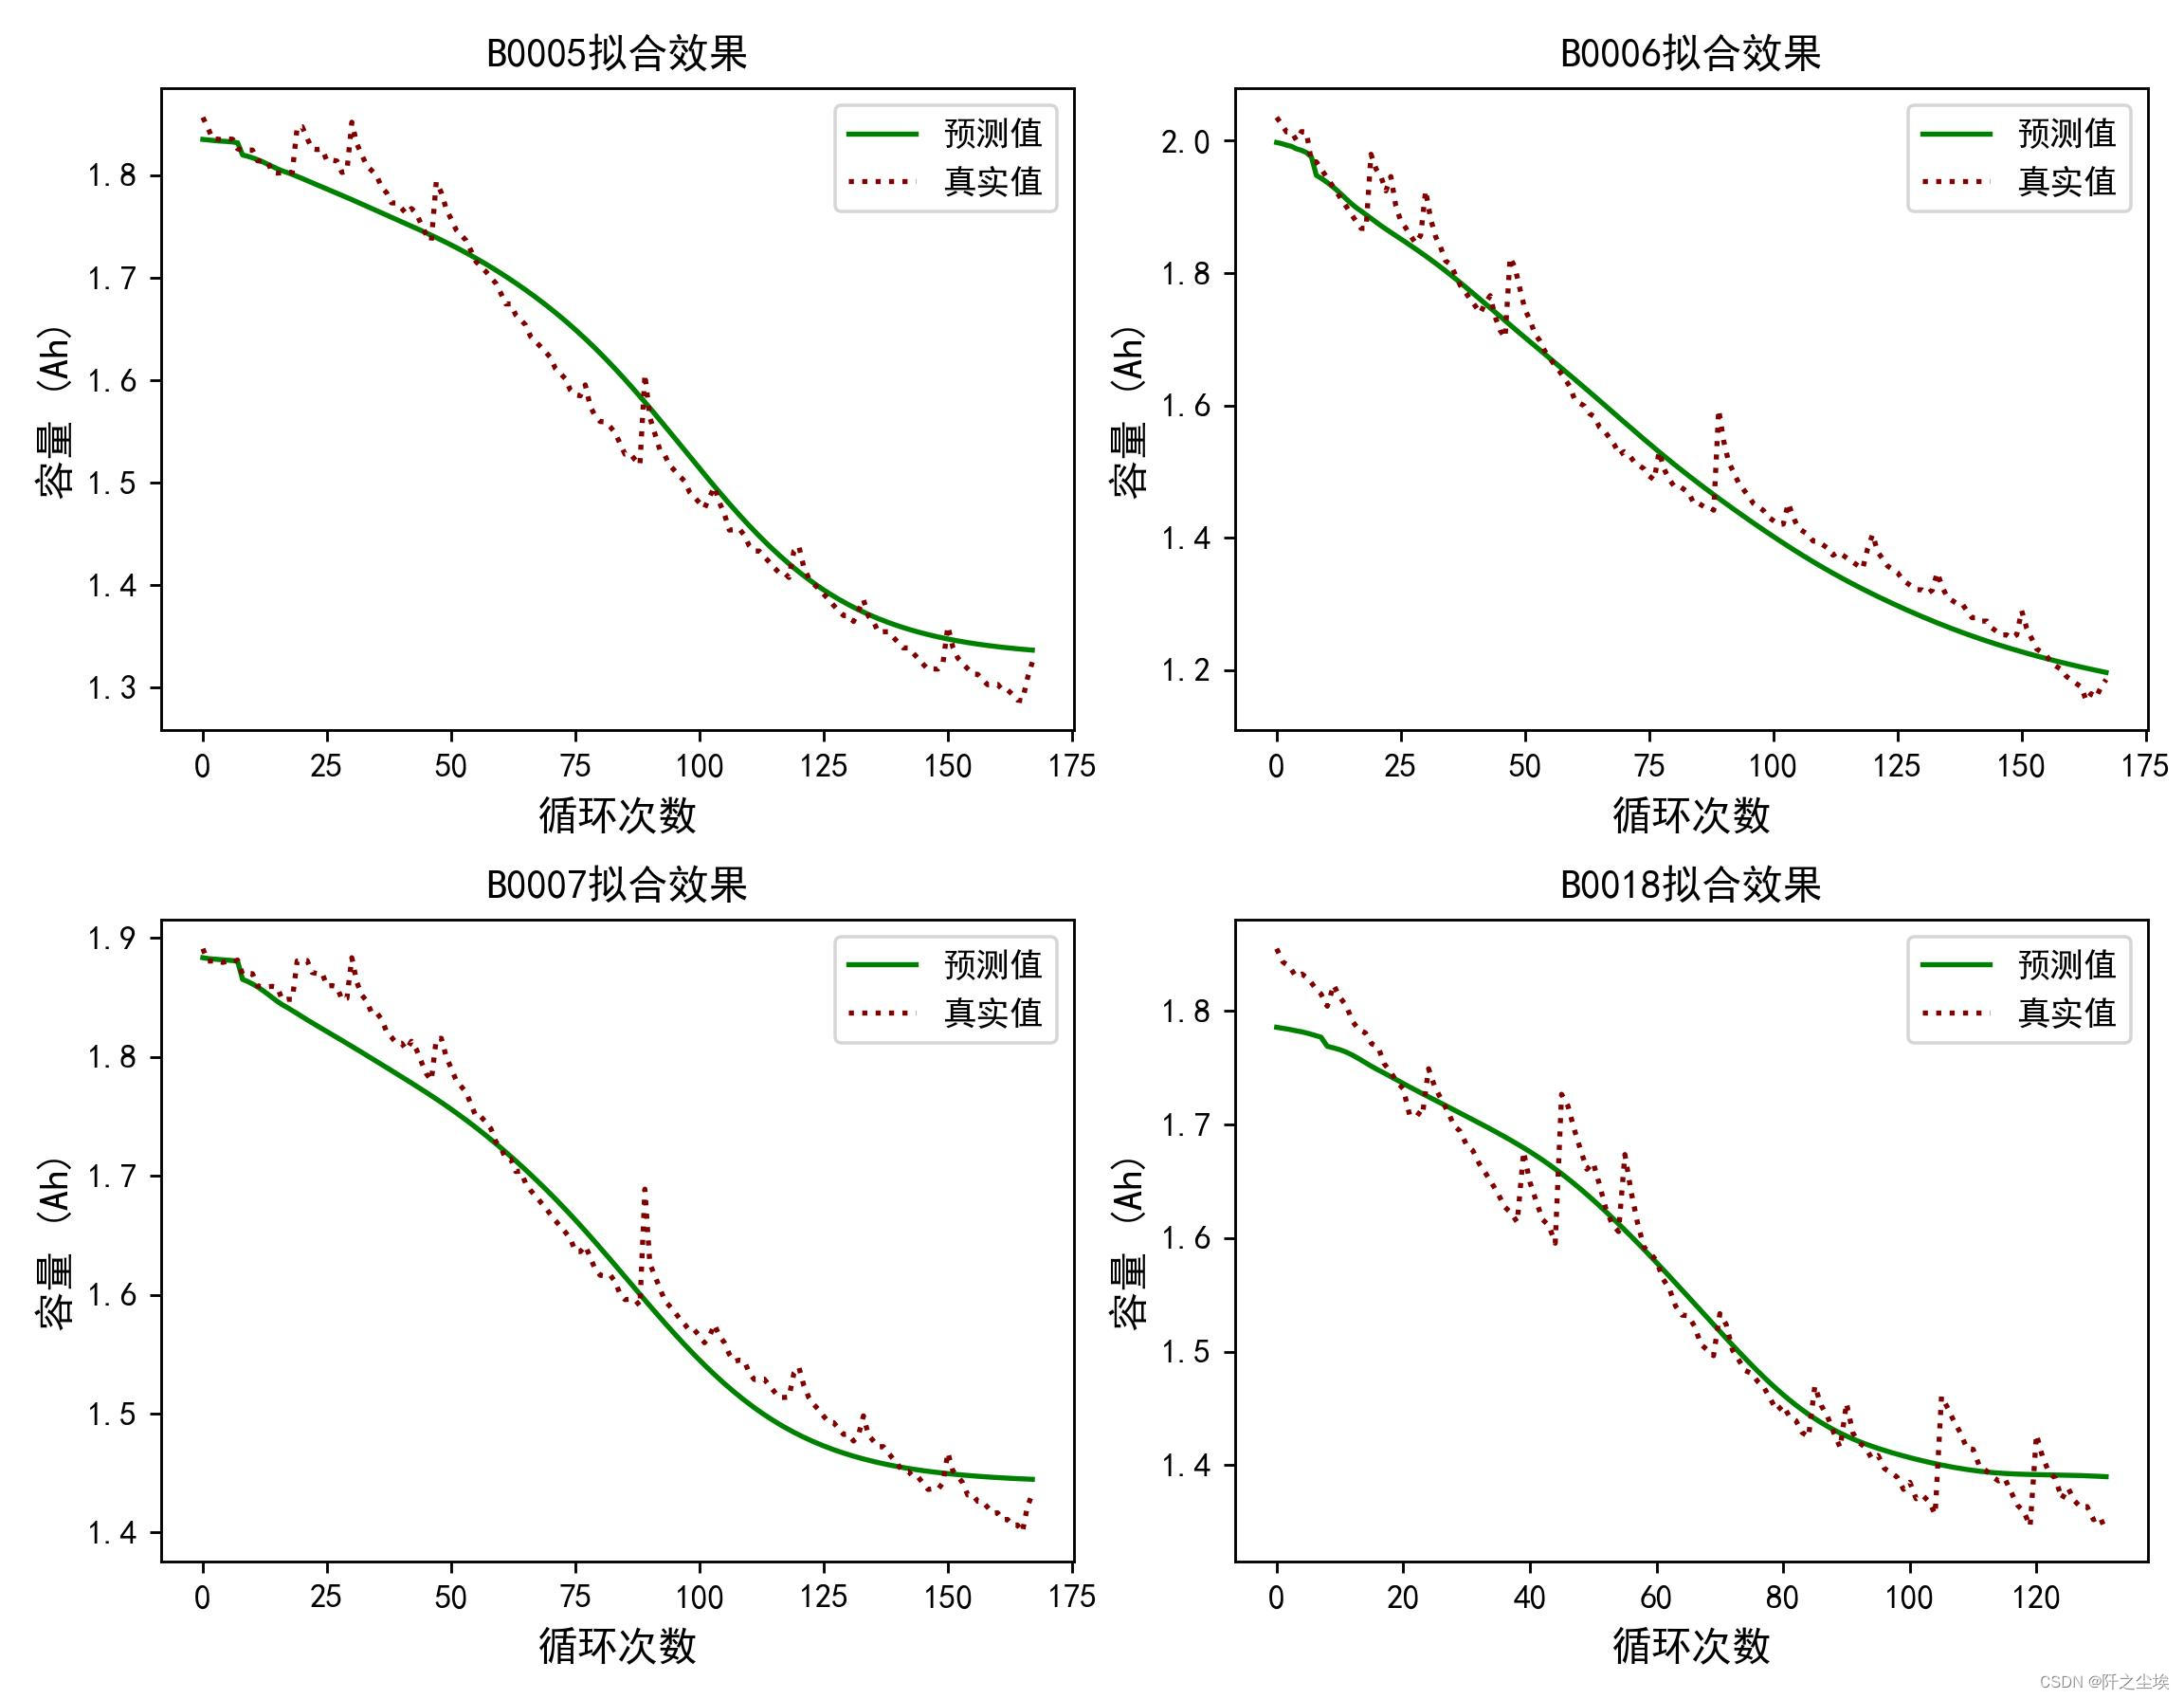
文章对比了单一模型和组合模型预测精度,加入了RF的组合模型预测精度让五种神经网络的表现都有进一步的提升。以NASA数据集作为研究对象进行该方法的性能测试。实验结果表明,CEEMDAN-RF-SED-LSTM模型对电池RUL预测表现效果好,预测结果相比单一模型具有更低的误差。
上面是摘要,原理我就不多介绍了,文章里面都有,这篇博客主要是分享怎么用这些神经网络构建时间序列预测的一个流程。只是部分代码,不是这篇文章的全部代码。
主要是使用模态分解将电池容量退化曲线进行分解,然后使用随机森林回归进行模态分量权重系数的调整,最后用神经网络进行预测后加和,文章里后面的编解码器结构这篇博客是没有。
数据来源
美国航天局NASA的电池数据集,很老了,NASA好像去年下架了这个数据集。但是网上还是有很多获取方式,当然原始数据使用matlab文件储存的,需要进行一定的处理和清洗才能提取出来用。
文章里面是4个电池都进行了测试,这篇博客就以一个电池,B0006的数据作为演示。
深度学习框架
用的是基于TensorFlow的Keras框架,会简单好上手一下。虽然pytorch在学术界很受欢迎,但是面向对象的编程实在是让编程小白难看得懂。。
代码实现准备
由于是一个较为系统性的文章的代码,所以我这里的代码风格会很分工明确,具有工程性质,而且封装程度很高,为了方便复用,会出现大量的调包和自定义函数,要一定编程思维基础才能看懂,没有前面的案例那么简单的一步一步平铺直述。
导入需要的包
import os
import math
import datetime
import random as rn
import numpy as np
import pandas as pd
import matplotlib.pyplot as plt
%matplotlib inline
plt.rcParams ['font.sans-serif'] ='SimHei'               #显示中文
plt.rcParams ['axes.unicode_minus']=False               #显示负号

from PyEMD import EMD,CEEMDAN,Visualisation

from sklearn.model_selection import train_test_split
from sklearn.preprocessing import MinMaxScaler
from sklearn.ensemble import RandomForestRegressor
from sklearn.metrics import mean_absolute_error
from sklearn.metrics import mean_squared_error

import tensorflow as tf
import keras
from keras.models import Model, Sequential
from keras.layers import GRU, Dense,Conv1D, MaxPooling1D,GlobalMaxPooling1D,Embedding,Dropout,Flatten,SimpleRNN,LSTM
#from keras.callbacks import EarlyStopping
#from tensorflow.keras import regularizers
#from keras.utils.np_utils import to_categorical
from tensorflow.keras import optimizers读取数据,进行CEEMDAN模态分解,然后画图查看分解结果:
data0=pd.read_csv('NASA电容量.csv',usecols=['B0006'])
S1 = data0.values
S = S1[:,0]
t = np.arange(0,len(S),1)
ceemdan=CEEMDAN()
ceemdan.ceemdan(S)
imfs, res = ceemdan.get_imfs_and_residue()
print(len(imfs))
vis = Visualisation()
vis.plot_imfs(imfs=imfs, residue=res, t=t , include_residue=False) 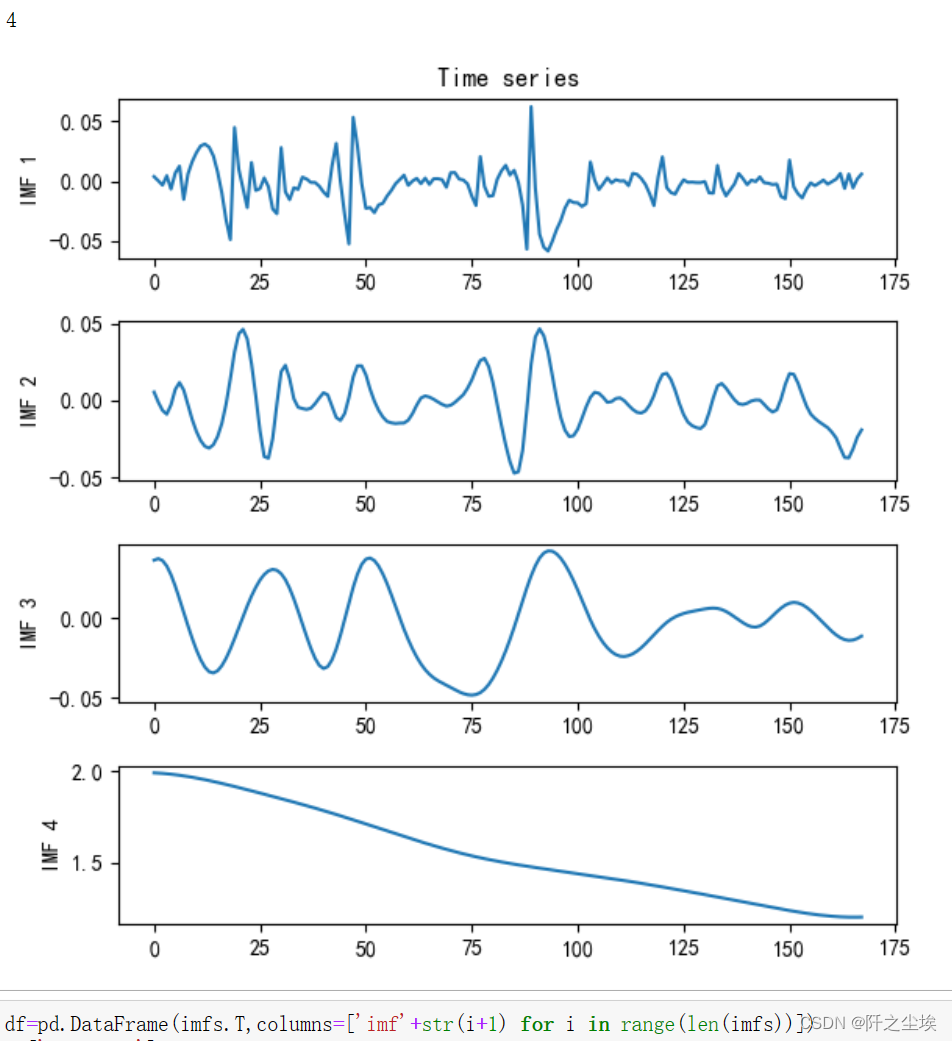
df=pd.DataFrame(imfs.T,columns=['imf'+str(i+1) for i in range(len(imfs))])
df['capacity']=data0.values
X_train=df.iloc[:,:-1]
y_train=df.iloc[:,-1]
model = RandomForestRegressor(n_estimators=5000, max_features=2, random_state=0)
model.fit(X_train, y_train)
model.score(X_train, y_train)
拟合优度99.9%
画出变量重要性
model.feature_importances_
sorted_index = model.feature_importances_.argsort()
plt.barh(range(X_train.shape[1]), model.feature_importances_[sorted_index])
plt.yticks(np.arange(X_train.shape[1]), X_train.columns[sorted_index])
plt.xlabel('Feature Importance')
plt.ylabel('Feature')
plt.title('Random Forest')
plt.tight_layout() 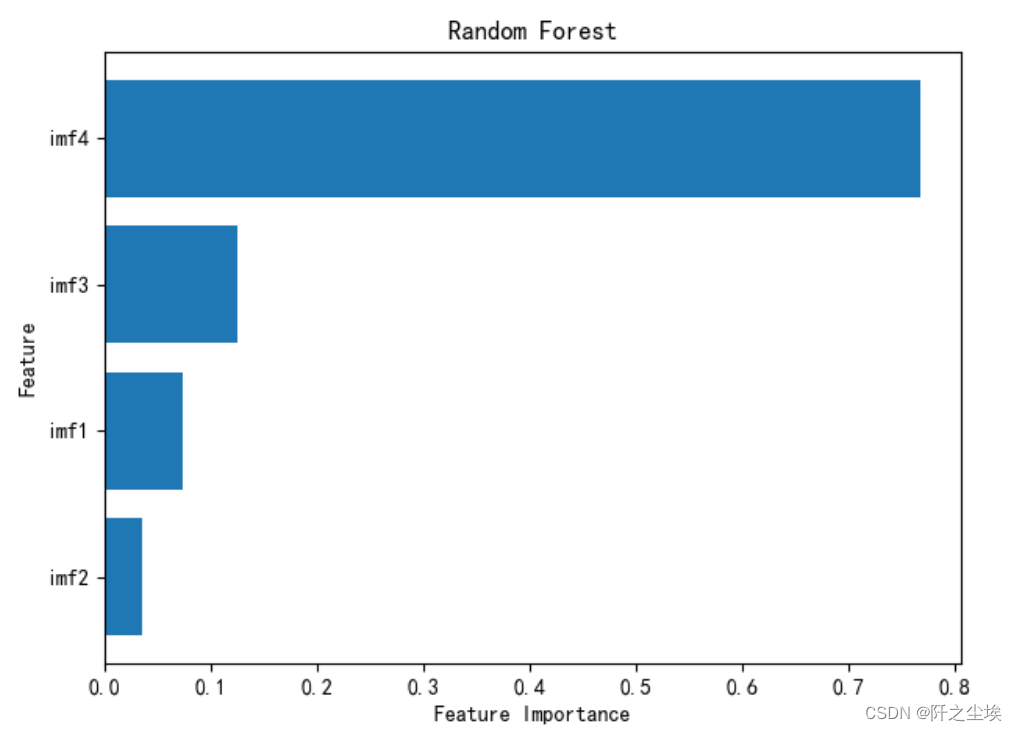
imf_names=X_train.columns[sorted_index][::-1]
imf_weight=model.feature_importances_[sorted_index][::-1]
imf_weight[0]=1
#imf_names,imf_weightdef set_my_seed():
os.environ['PYTHONHASHSEED'] = '0'
np.random.seed(1)
rn.seed(12345)
tf.random.set_seed(123)
def evaluation(y_test, y_predict):
mae = mean_absolute_error(y_test, y_predict)
mse = mean_squared_error(y_test, y_predict)
rmse = math.sqrt(mean_squared_error(y_test, y_predict))
mape=(abs(y_predict -y_test)/ y_test).mean()
return mae, rmse, mape
def relative_error(y_test, y_predict, threshold):
true_re, pred_re = len(y_test), 0
for i in range(len(y_test)-1):
if y_test[i] <= threshold >= y_test[i+1]:
true_re = i - 1
break
for i in range(len(y_predict)-1):
if y_predict[i] <= threshold:
pred_re = i - 1
break
return abs(true_re - pred_re)/true_re定义构建序列的函数,从序列数据中获取训练集和测试集对应的解释变量和响应变量
def build_sequences(text, window_size=4):
    #text:list of capacity
    x, y = [],[]
    for i in range(len(text) - window_size):
        sequence = text[i:i+window_size]
        target = text[i+window_size]
        x.append(sequence)
        y.append(target)
    return np.array(x), np.array(y)
def get_traintest(data,train_size=len(data0),window_size=4):
    train=data[:train_size]
    test=data[train_size-window_size:]
    X_train,y_train=build_sequences(train,window_size=window_size)
    X_test,y_test=build_sequences(test)
return X_train,y_train,X_test,y_test定义构建模型的函数,还有画出损失图的函数,和拟合效果评价和对比函数:
def build_model(X_train,mode='LSTM',hidden_dim=[32,16]):
    set_my_seed()
    model = Sequential()
    if mode=='RNN':
        #RNN
        model.add(SimpleRNN(hidden_dim[0],return_sequences=True, input_shape=(X_train.shape[-2],X_train.shape[-1])))
        model.add(SimpleRNN(hidden_dim[1]))

    elif mode=='MLP':
        model.add(Dense(hidden_dim[0],activation='relu',input_shape=(X_train.shape[-1],)))
        model.add(Dense(hidden_dim[1],activation='relu'))

    elif mode=='LSTM':
        # LSTM
        model.add(LSTM(hidden_dim[0],return_sequences=True, input_shape=(X_train.shape[-2],X_train.shape[-1])))
        model.add(LSTM(hidden_dim[1]))
    elif mode=='GRU':
        #GRU
        model.add(GRU(hidden_dim[0],return_sequences=True, input_shape=(X_train.shape[-2],X_train.shape[-1])))
        model.add(GRU(hidden_dim[1]))
    elif mode=='CNN':
        #一维卷积
        model.add(Conv1D(hidden_dim[0],3,activation='relu',input_shape=(X_train.shape[-2],X_train.shape[-1])))
        model.add(GlobalMaxPooling1D())

    model.add(Dense(1))
    model.compile(optimizer='Adam', loss='mse',metrics=[tf.keras.metrics.RootMeanSquaredError(),"mape","mae"])
    return model

def plot_loss(hist,imfname):
    plt.subplots(1,4,figsize=(16,2))
    for i,key in enumerate(hist.history.keys()):
        n=int(str('14')+str(i+1))
        plt.subplot(n)
        plt.plot(hist.history[key], 'k', label=f'Training {key}')
        plt.title(f'{imfname} Training {key}')
        plt.xlabel('Epochs')
        plt.ylabel(key)
        plt.legend()
    plt.tight_layout()
    plt.show()

def evaluation_all(df_RFW_eval_all,df_eval_all,mode,Rated_Capacity=2,show_fit=True):
    df_RFW_eval_all['all_pred']=df_RFW_eval_all.iloc[:,1:].sum(axis=1)
    df_eval_all['all_pred']=df_eval_all.iloc[:,1:].sum(axis=1)

    MAE1,RMSE1,MAPE1=evaluation(df_RFW_eval_all['capacity'],df_RFW_eval_all['all_pred'])
    RE1=relative_error(df_RFW_eval_all['capacity'],df_RFW_eval_all['all_pred'],threshold=Rated_Capacity*0.7)

    MAE2,RMSE2,MAPE2=evaluation(df_eval_all['capacity'],df_eval_all['all_pred'])
    RE2=relative_error(df_eval_all['capacity'],df_eval_all['all_pred'],threshold=Rated_Capacity*0.7)

    df_RFW_eval_all.rename(columns={'all_pred':'predict','capacity':'actual'},inplace=True)
    if show_fit:
        df_RFW_eval_all.loc[:,['predict','actual']].plot(figsize=(10,4),title=f'CEEMDAN+RF+{mode}的拟合效果')

    print(f'CEEMDAN+RF+{mode}的效果为mae:{MAE1}, rmse:{RMSE1} ,mape:{MAPE1}, re:{RE1}')
    print(f'CEEMDAN+{mode}的效果为mae:{MAE2}, rmse:{RMSE2} ,mape:{MAPE2}, re:{RE2}')
def train_fuc(mode='LSTM',window_size=8,batch_size=32,epochs=100,hidden_dim=[32,16],Rated_Capacity=2,show_imf=False,show_loss=True,show_fit=True):
    df_RFW_eval_all=pd.DataFrame(df['capacity'])
    df_eval_all=pd.DataFrame(df['capacity'])
    for i,imfname in  enumerate(imf_names):

        print(f'正在处理分量信号:{imfname}')
        data=df[imfname]
        X_train,y_train,X_test,y_test=get_traintest(data.values,window_size=window_size,train_size=len(data))
        if mode!='MLP':
            X_train = X_train.reshape((X_train.shape[0], X_train.shape[1], 1))
        #print(X_train.shape, y_train.shape)
        start = datetime.datetime.now()
        set_my_seed()
        model=build_model(X_train=X_train,mode=mode,hidden_dim=hidden_dim)
        hist=model.fit(X_train, y_train,batch_size=batch_size,epochs=epochs,verbose=0)
        if show_loss:
            plot_loss(hist,imfname)
        #预测
        point_list = list(data[:window_size].values.copy())
        y_pred=[]
        while (len(point_list)) < len(data.values):
            x = np.reshape(np.array(point_list[-window_size:]), (-1, window_size)).astype(np.float32)
            pred = model.predict(x)
            next_point = pred[0,0]
            point_list.append(next_point)#加入原来序列用来继续预测下一个点
            #point_list.append(next_point)#保存输出序列最后一个点的预测值
        y_pred.append(point_list)#保存本次预测所有的预测值
        y_pred=np.array(y_pred).T
        #print(y_pred.shape)
        end = datetime.datetime.now()

        if show_imf:
            df_eval=pd.DataFrame()
            df_eval['actual']=data.values
            df_eval['pred']=y_pred
        mae, rmse, mape=evaluation(y_test=data.values, y_predict=y_pred)
        print(f'{imfname}该分量的效果:mae:{mae}, rmse:{rmse} ,mape:{mape}')
        df_eval_all[imfname+'_w_pred']=y_pred
        df_RFW_eval_all[imfname+'_w_pred']=y_pred*imf_weight[i]
        print('============================================================================================================================')
    evaluation_all(df_RFW_eval_all,df_eval_all,mode=mode,Rated_Capacity=Rated_Capacity,show_fit=show_fit)
print(f'running time is {end-start}')训练函数是把前面的自定义函数都用上了的,想看懂得把所有自定义函数的功能弄明白。
window_size=8
batch_size=16
epochs=100
hidden_dim=[32,16]
Rated_Capacity=2
show_fit=True
show_loss=True
mode='LSTM' #RNN,GRU,CNNRated_Capacity 是电池的容量初始值,NASA里面的电池初始值是2
模型训练和评价
上面的代码封装了所有的流程,接下来的训练和评价只需要改参数就行了。
LSTM预测
mode='LSTM'
set_my_seed()
train_fuc(mode=mode,window_size=window_size,batch_size=batch_size,epochs=epochs,hidden_dim=hidden_dim,Rated_Capacity=Rated_Capacity)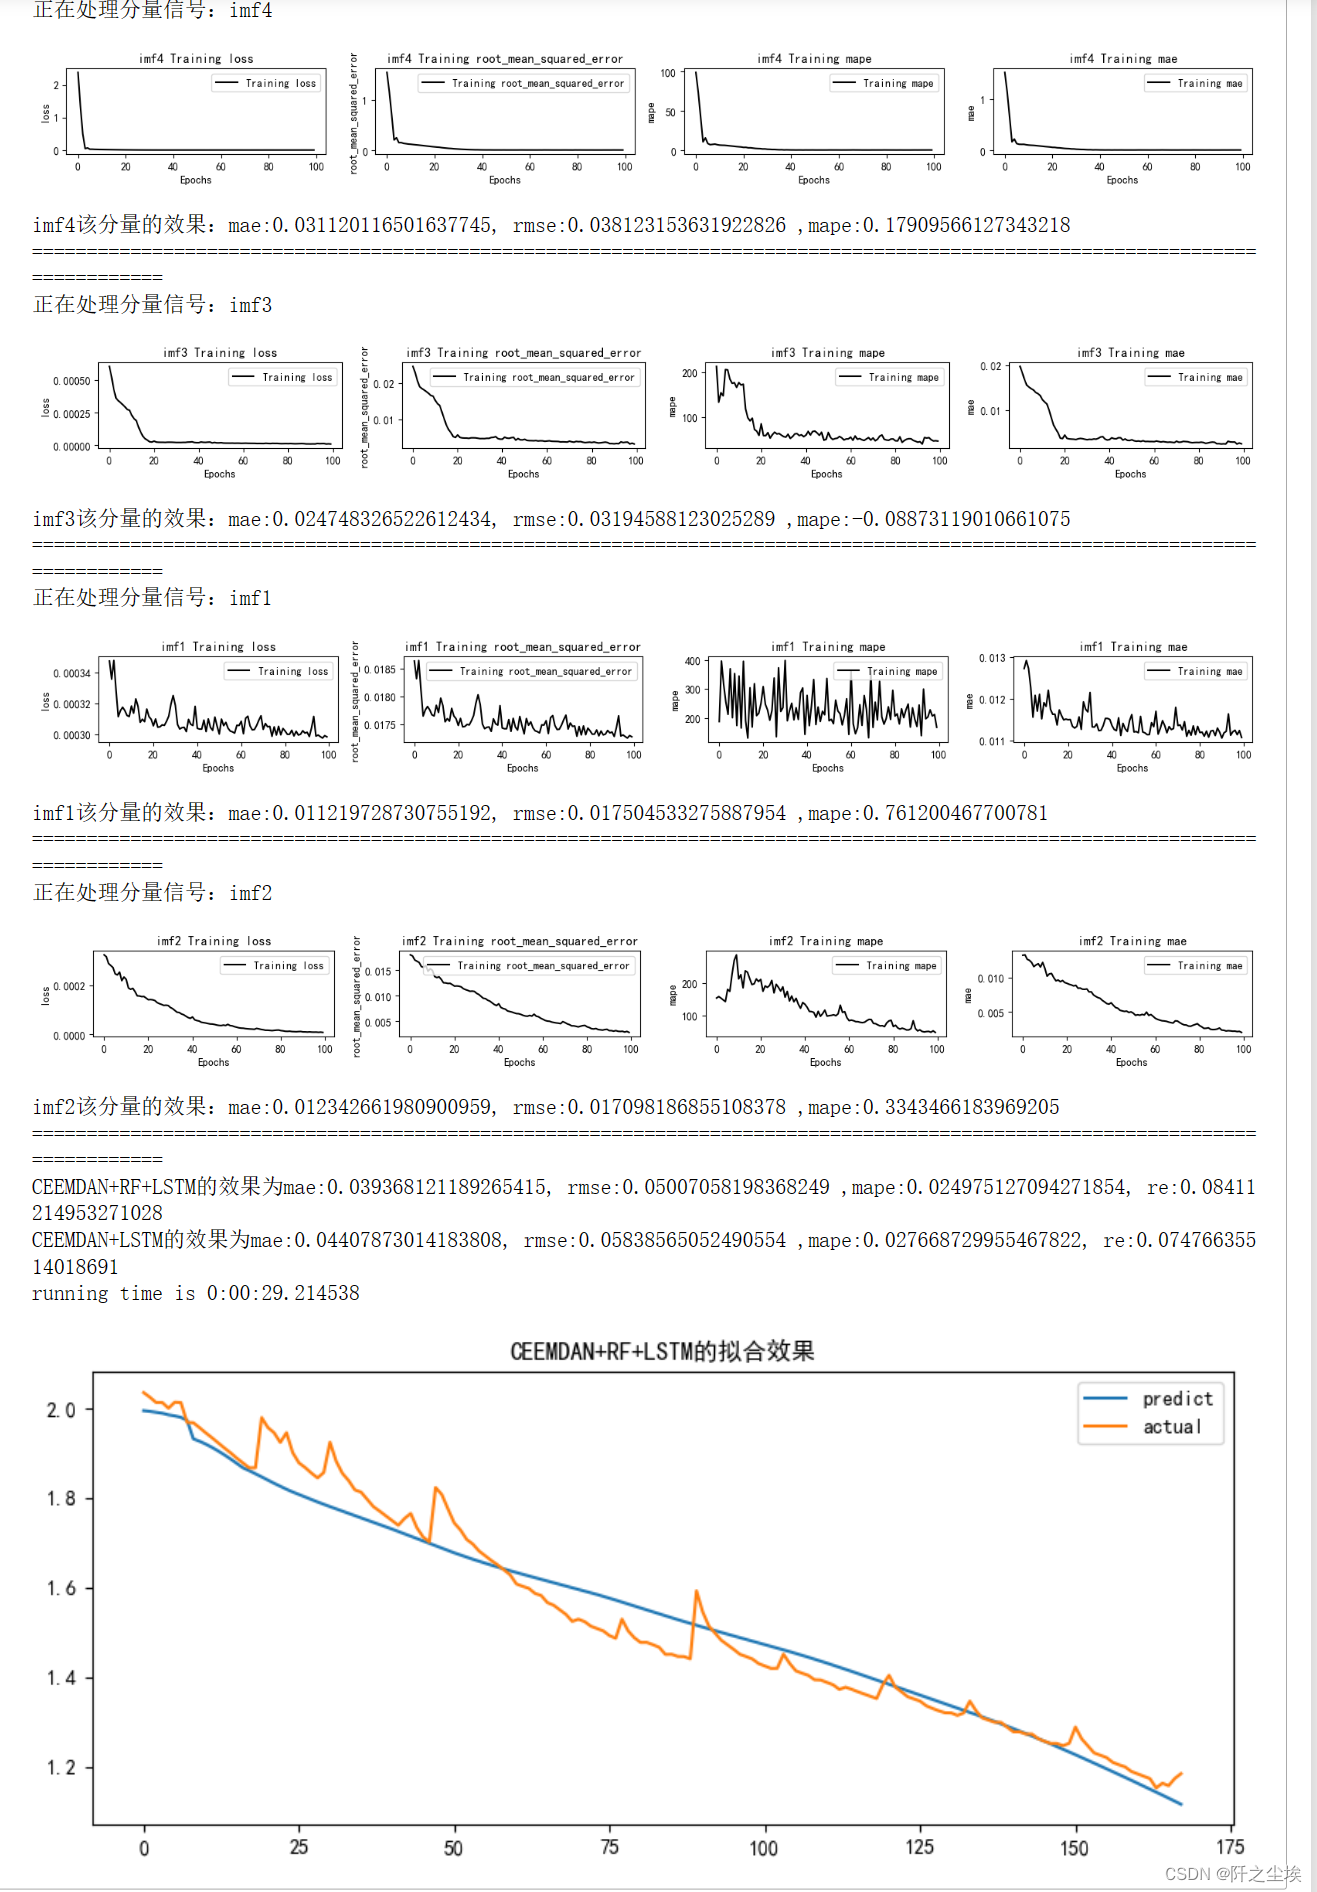
输出效果如上,会打印每一个分量的训练损失变化,点估计的评价指标,还有最终的加了随机森林和没加随机森林的总体预测效果的评价指标。
(我的anaconda之前重装过一次,环境变了,居然跑不出论文里面的那个数值了….但是差异不大,比如mae,这里是0.039368,论文里面是0.039161,其他指标也差不多)
如果想改变其他参数就直接在序列函数里面改就行了,比如想用滑动窗口为16:
train_fuc(window_size=16)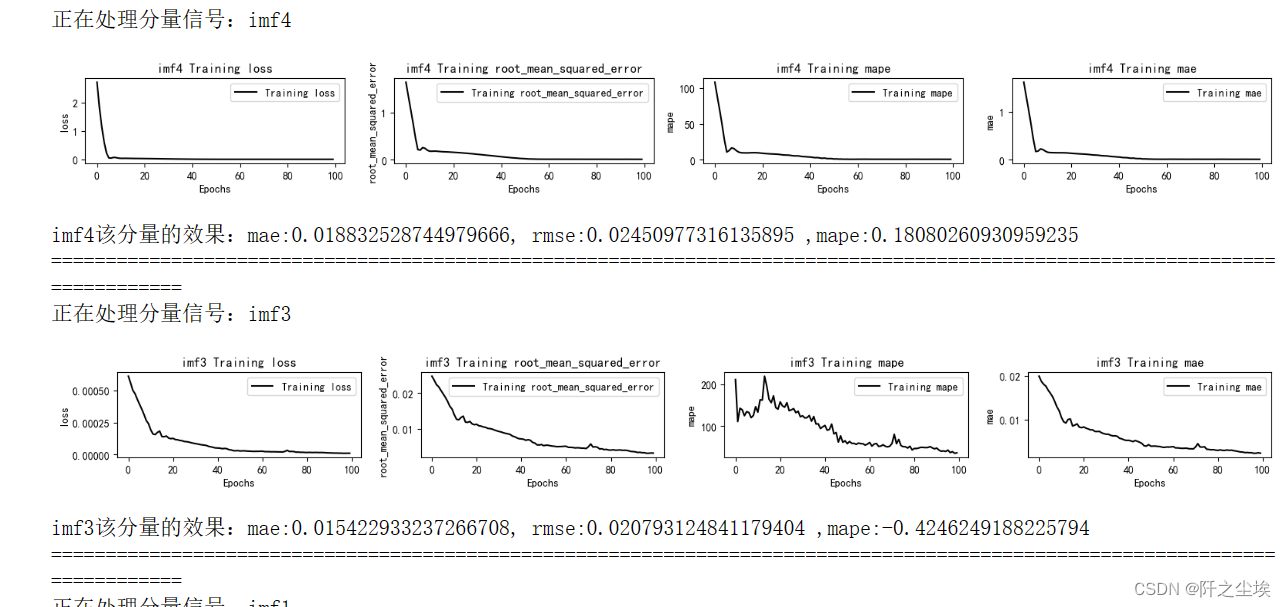
train_fuc(hidden_dim=[64,32])很简洁,很方便。
RNN预测
修改mode参数就行
mode='RNN'
set_my_seed()
train_fuc(mode=mode,window_size=window_size,batch_size=32,epochs=epochs,hidden_dim=hidden_dim,Rated_Capacity=Rated_Capacity)
图太长就不截完了,只看最后的评价指标计算的结果。(也是一样,由于运行的环境重装过,所以现在的运行结果和我论文里面有细微的差异)

GRU预测
mode='GRU'
set_my_seed()
train_fuc(mode=mode,window_size=window_size,batch_size=batch_size,epochs=epochs,hidden_dim=hidden_dim,Rated_Capacity=Rated_Capacity)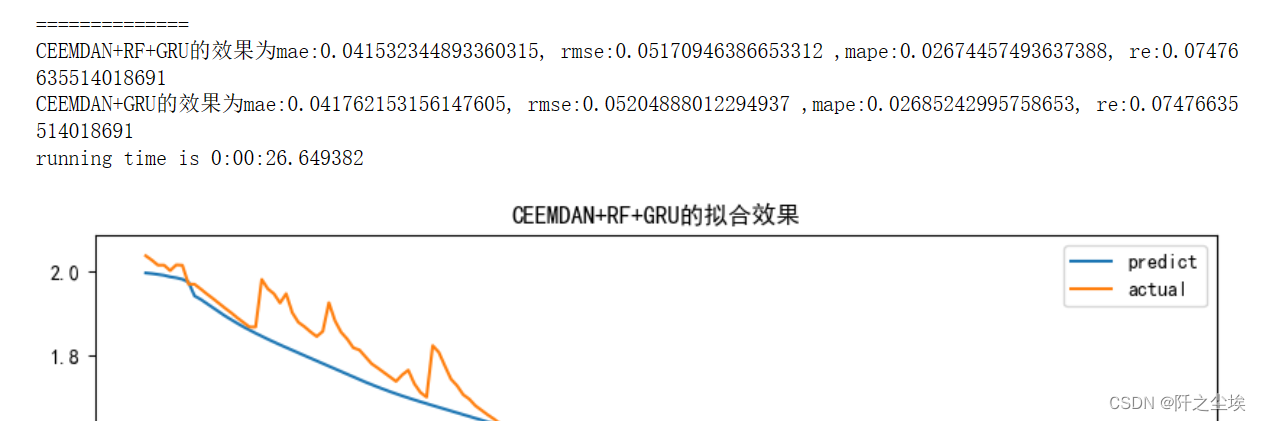
一维CNN预测
mode='CNN'
set_my_seed()
train_fuc(mode=mode,window_size=window_size,batch_size=batch_size,epochs=epochs,hidden_dim=hidden_dim,Rated_Capacity=Rated_Capacity)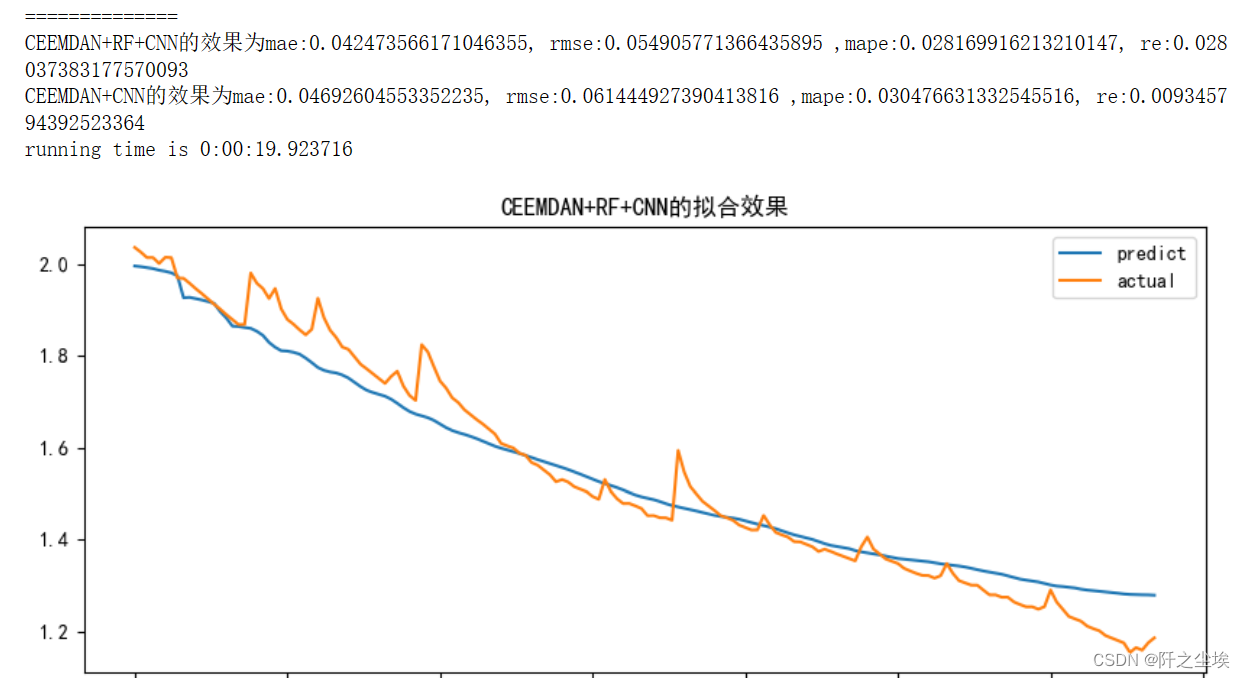
MLP预测
mode='MLP'
set_my_seed()
train_fuc(mode=mode,window_size=window_size,batch_size=batch_size,epochs=90,hidden_dim=hidden_dim,Rated_Capacity=Rated_Capacity)
其他超参数我没太花时间调整,因为神经网络一次运行时间有点长,若有同学有兴趣可以多试试超参数的调整,说不定能得到更好的预测效果。
原文地址:https://blog.csdn.net/weixin_46277779/article/details/129667287
本文来自互联网用户投稿,该文观点仅代表作者本人,不代表本站立场。本站仅提供信息存储空间服务,不拥有所有权,不承担相关法律责任。
如若转载,请注明出处:http://www.7code.cn/show_26884.html
如若内容造成侵权/违法违规/事实不符,请联系代码007邮箱:suwngjj01@126.com进行投诉反馈,一经查实,立即删除!

