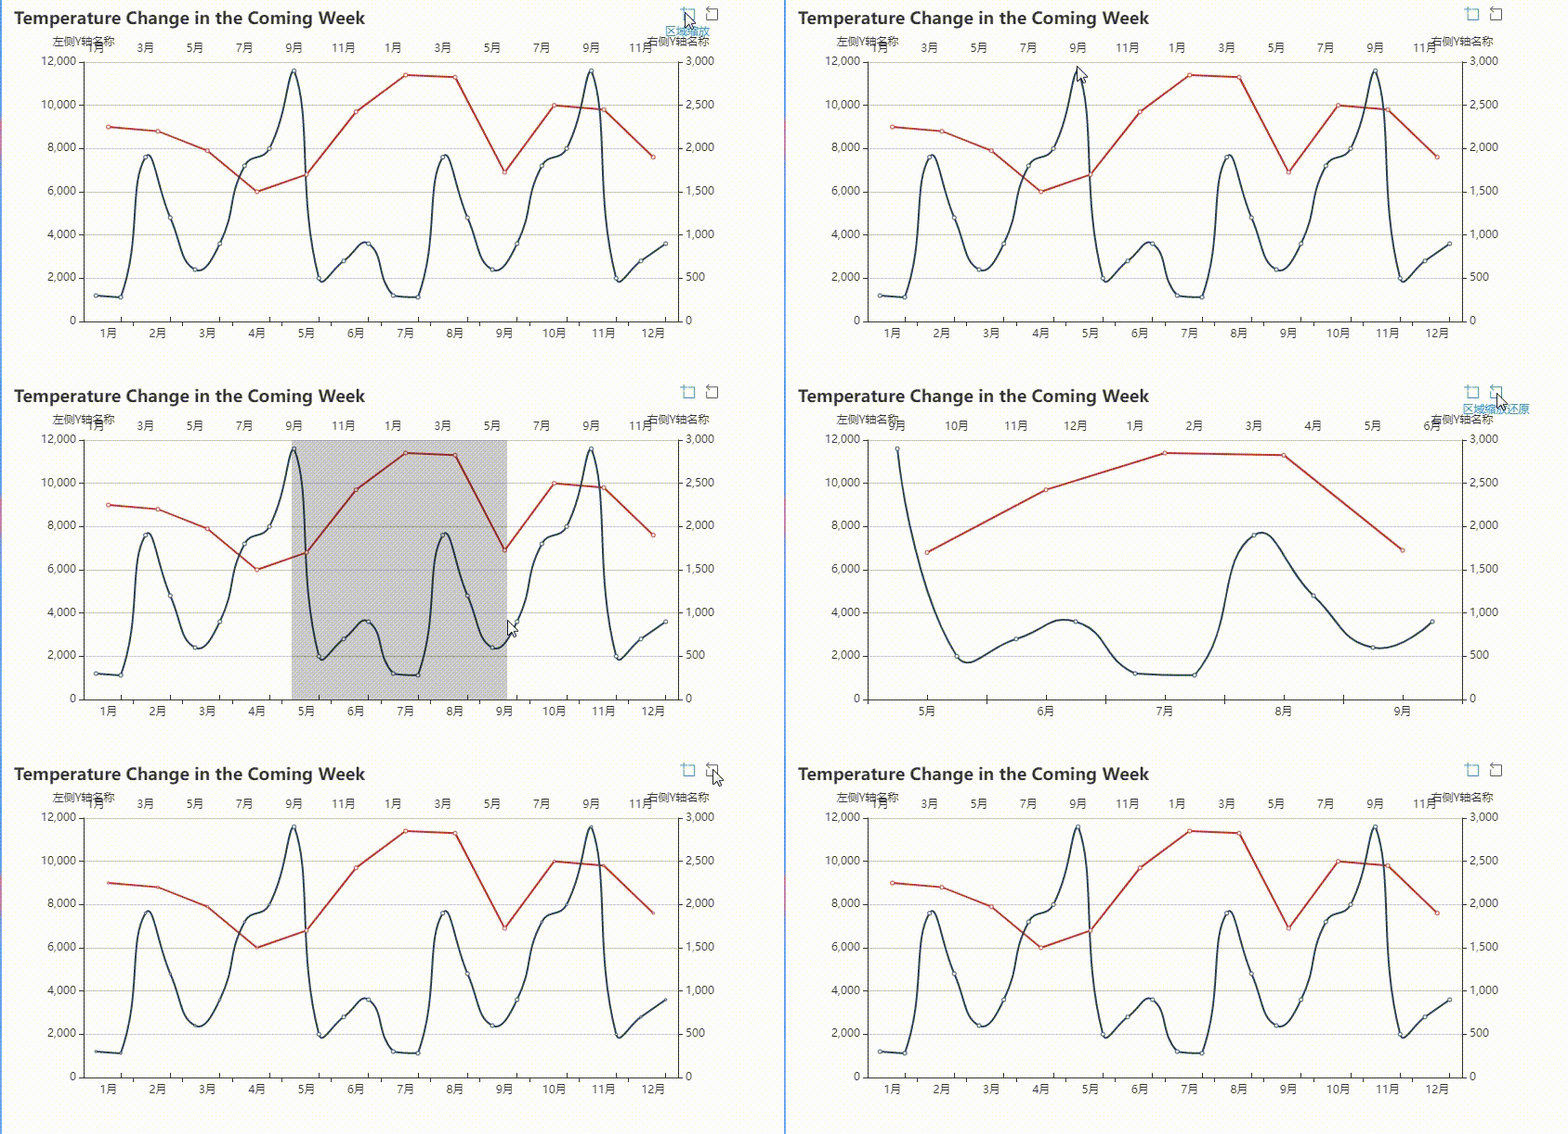
需求:echarts图表上的数据很多时,想要查看部分区域的数据状态,可以通过数据区域缩放来实现,并获取缩放后当前x轴的起始点
选框缩放
	var mCharts = echarts.init(document.querySelector('div'))
    var xDataArr1 = ['1月', '2月', '3月', '4月', '5月', '6月', '7月', '8月', '9月', '10月', '11月', '12月','1月', '2月', '3月', '4月', '5月', '6月', '7月', '8月', '9月', '10月', '11月', '12月']
    var xDataArr = ['1月', '2月', '3月', '4月', '5月', '6月', '7月', '8月', '9月', '10月', '11月', '12月']
    var yDataArr1 = [9000, 8800,7900, 6000, 6800, 9700, 11400, 11300, 6900, 10000, 9800, 7600]
    var yDataArr2 = [300, 280, 1900, 1200, 600, 900, 1800, 2000, 2900, 500, 700, 900,300, 280, 1900, 1200, 600, 900, 1800, 2000, 2900, 500, 700, 900]
    var option = {
      title: {
        text: '选框缩放'
      },
      xAxis: [{
        type: 'category',
        data: xDataArr
      },{
        triggerEvent: true,
        type: 'category',
        data: xDataArr1
      }],
      yAxis: [{
        name:'左侧Y轴',
        type: 'value'
      },{
        name:'右侧Y轴',
        type: 'value'
      }],
      toolbox: {
        show:true,
        feature:{
          dataZoom: {
            yAxisIndex:"none"
          },//其他功能性按钮查看官网进行增加,包括(显示数据,下载图片,改为柱状图等)
        },
        right:30,
        top:-8
      },
      series: [
        {
          xAxisIndex:0,
          yAxisIndex: 0,//使用哪条y轴
          data: yDataArr1,
          type: 'line', // 设置图表类型为 折线图
        },
        {
          xAxisIndex:1,
          yAxisIndex: 1,
          data: yDataArr2,
          type: 'line', // 设置图表类型为 折线图
          smooth:true, // 设置图表平滑
        }
      ]
    }
    mCharts.setOption(option)
    // 缩放后的起始点数据
    mCharts.on('datazoom', (params) =>{
      console.log( mCharts.getModel().option);
      let dataZoomStartIndex1 = mCharts.getModel().option.dataZoom[0].startValue;
      let dataZoomEndIndex1 = mCharts.getModel().option.dataZoom[0].endValue;
      let dataZoomStartIndex2 = mCharts.getModel().option.dataZoom[1].startValue;
      let dataZoomEndIndex2 = mCharts.getModel().option.dataZoom[1].endValue;
      //缩放后,两条x轴的起始点
      console.log(xDataArr[dataZoomStartIndex1]);
      console.log(xDataArr[dataZoomEndIndex1]);
      console.log(xDataArr1[dataZoomStartIndex2]);
      console.log(xDataArr1[dataZoomEndIndex2]);
    });
效果图:
鼠标滚轮缩放

效果图:

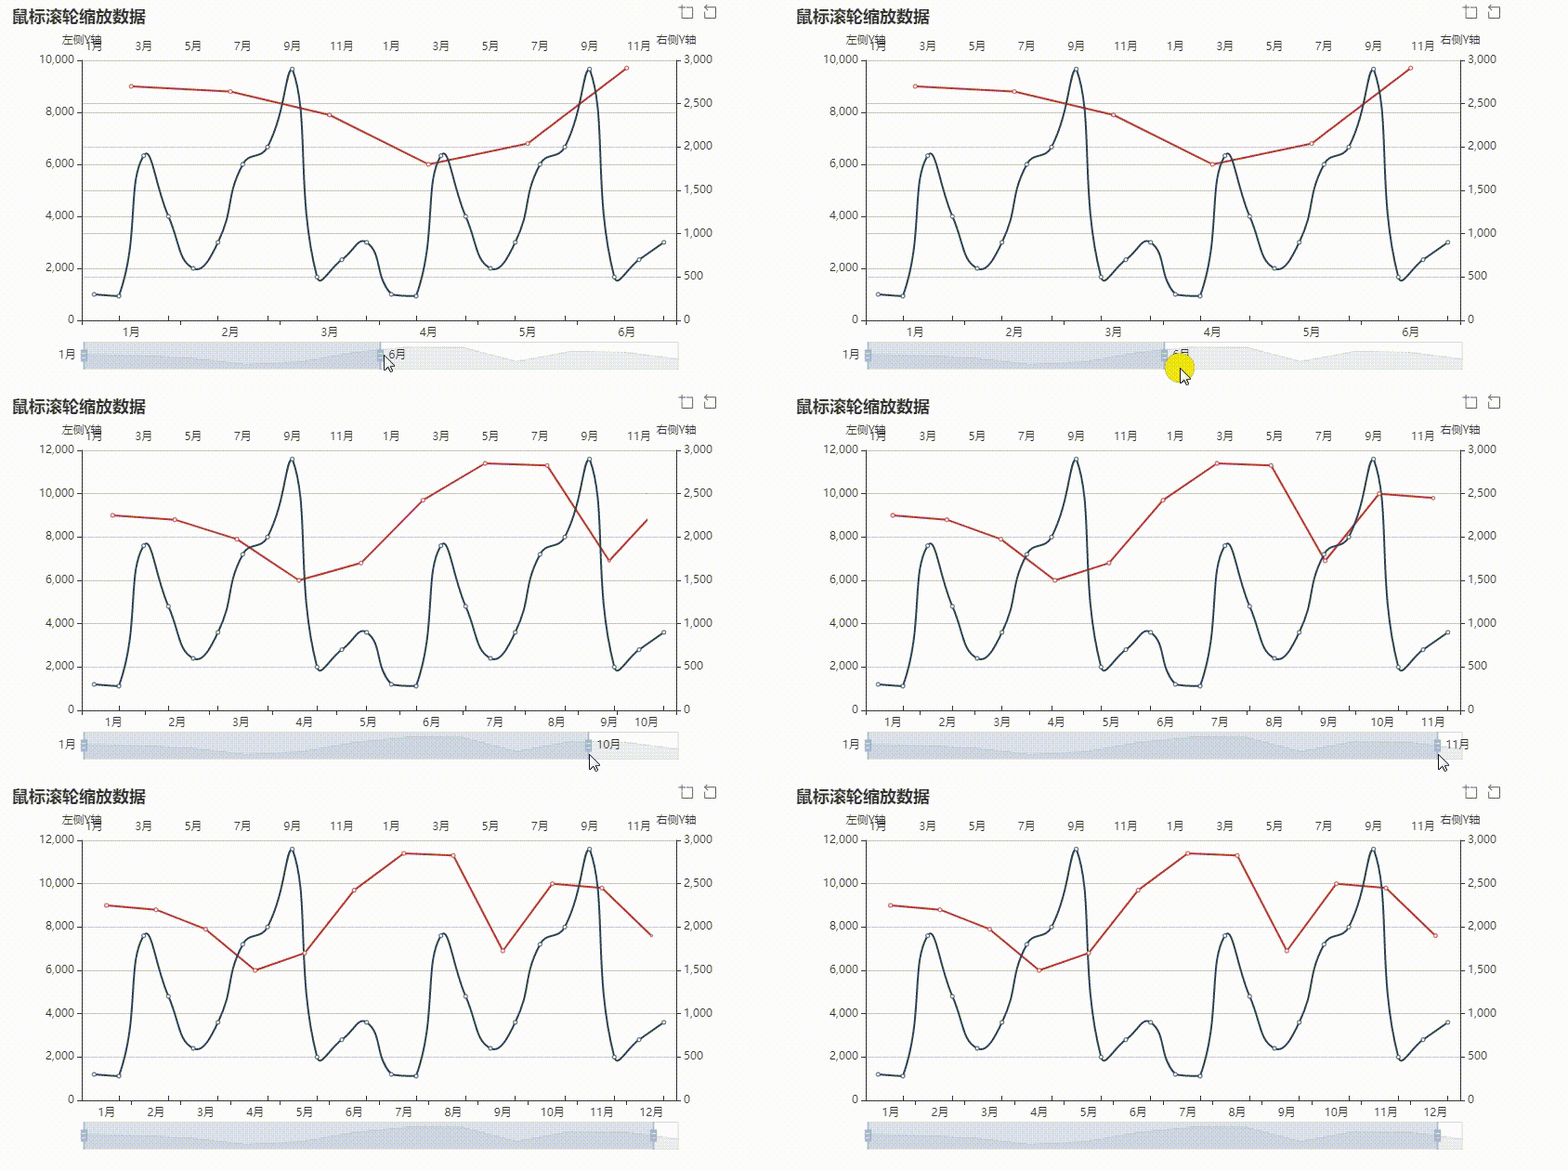
滚动条缩放
 dataZoom:[{
        type: 'slider',//图表下方的伸缩条
     show : true, //是否显示
     realtime : true, //拖动时,是否实时更新系列的视图
     start : 0, //伸缩条开始位置(1-100),可以随时更改
     end : 100, //伸缩条结束位置(1-100),可以随时更改
      }],
效果图:
原文地址:https://blog.csdn.net/weixin_43883951/article/details/128861972
本文来自互联网用户投稿,该文观点仅代表作者本人,不代表本站立场。本站仅提供信息存储空间服务,不拥有所有权,不承担相关法律责任。
如若转载,请注明出处:http://www.7code.cn/show_27676.html
如若内容造成侵权/违法违规/事实不符,请联系代码007邮箱:suwngjj01@126.com进行投诉反馈,一经查实,立即删除!
声明:本站所有文章,如无特殊说明或标注,均为本站原创发布。任何个人或组织,在未征得本站同意时,禁止复制、盗用、采集、发布本站内容到任何网站、书籍等各类媒体平台。如若本站内容侵犯了原著者的合法权益,可联系我们进行处理。

