文章目录
-
- 换图片 icon-image表达式 case match
- 换线的颜色 match
- 换点的颜色 match
- 设置地图中心 setCenter
- 图层显示 隐藏 visibility
- 图层不忽略短线
- 筛选 setFilter
- 圆的半径大小随着zoom变化,interpolate
- 鼠标划过 获取对应的经纬度 e.lngLat
- 鼠标划过 线 点 获取坐标
- 给点图层(circle) 加标志 Marker
- queryRenderedFeatures
- debounce 防抖
- 指定图层层级 例如让某图层置于最上方
- 地图居中 fitBounds
- 地图切换2d 3d setProjection
- 恢复倾斜角度setPitch,恢复旋转角度rotateTo
- 缩放 获取层级getZoom
- 获取当前已上图的所有的图层 getStyle
- 图标稀疏
- 添加标记点marker
- 表达式case:
- 表达式step
- 表达式interpolate 插值
- mapbox 图标动态光圈效果
- 设置 地图缩放 并完整展示一套线 turfjs fitBounds
- 聚合(cluster)效果
- 图标加动态光圈效果
- mapbox-gl Invalid string length
换图片 icon–image表达式 case match
window.rootMap.map.setLayoutProperty(
  `图层名`,
  "icon-image",
  `qlNotSelect`
);
window.rootMap.map.setLayoutProperty(
  `图层名`,
   "icon-image",
   [
     'case',
      ['==', ['get', 'status'], 3],
      'imageIcon1', // status=3,图片设置为imageIcon1
      ['all', ['==', ['get', 'status'], 2], ['==', ['get', 'statusA'], 1]],
      'imageIcon2',// status=2 并且statusA=1,图片设置为imageIcon2
      ['all', ['==', ['get', 'status'], 2], ['==', ['get', 'statusA'], 2]],
      'imageIcon3',// status=2 并且statusA=2,图片设置为imageIcon3
      'imageIcon',//默认值
   ],
 );
this.map.setLayoutProperty("图层名", "icon-image", [
  "match",
  ["get", "age"],
  "12",
  "imageIcon1", // age=12 图片设置为imageIcon1
  "13",
  "imageIcon2",// age=13 图片设置为imageIcon2
  "14",
  "imageIcon3",// age=14 图片设置为imageIcon3
  "imageIcon1", // 默认图片设置为imageIcon3
]);
换线的颜色 match
this.map.setPaintProperty('图层名', 'line-color', [
     'match',
      ['get', 'age'],
      '11',
      '#F39C12',
      '12',
      'red',
      '#FDDF6B',
    ]);
换点的颜色 match
this.map.setPaintProperty('图层名', 'circle-color', [
     'match',
      ['get', 'age'],
      '11',
      '#F39C12',
      '12',
      'red',
      '#FDDF6B',
    ]);
设置地图中心 setCenter
window.rootMap.map.setCenter([160,39]);
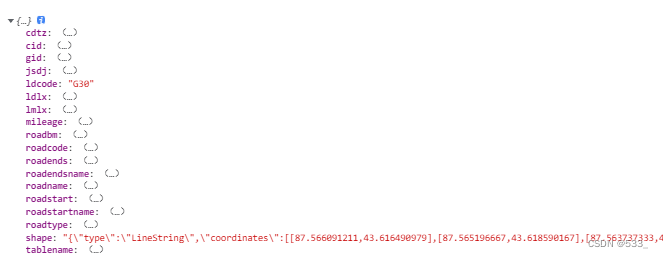
const shape = JSON.parse(data.shape).coordinates[0];

if (JSON.parse(data.shape).type === 'MultiLineString') {
  window.rootMap.map.setCenter(shape[parseInt(shape.length / 2, 0)]);
} else {
  window.rootMap.map.setCenter(shape);
}
图层显示 隐藏 visibility
window.rootMap.map.setLayoutProperty('图层', 'visibility', 'visible');
window.rootMap.map.setLayoutProperty('图层', 'visibility', 'none');
图层不忽略短线
线 的数据
  gis_name_lkpd: {
    type: 'geojson',
    data: {
      type: 'FeatureCollection',
      features: [],
    },
    clusterMaxZoom: 14,
    clusterRadius: 50,
    tolerance: 0, // 不忽略短线
  },
gis_name_border: {
    type: 'geojson',
    data: {
      type: 'FeatureCollection',
      features: [],
    },
    clusterMaxZoom: 14,
    clusterRadius: 50,
    tolerance: 0, // 不忽略短线
  },
图层
// 线
{
    id: 'gis_name',
    source: 'gis_name',
    type: 'line',
    features: [],
    layout: {
      visibility: 'none',
      'line-join': 'round',
      'line-cap': 'round',
    },
    paint: {
      'line-width': 4,
      'line-color': '#FFCB05',
    },
  },
// 线的边框
  {
    id: 'gis_name_border',
    source: 'gis_name_border',
    type: 'line',
    features: [],
    layout: {
      visibility: 'none',
      'line-join': 'round',
      'line-cap': 'round',
    },
    paint: {
      'line-width': 6,
      'line-color': 'red',
    },
  },
筛选 setFilter
// 只显示age设计11的部分
window.rootMap.map.setFilter('图层名', [
          '==',
          ['get', 'age'],
          11
        ]);
// 只显示age不是11的部分
window.rootMap.map.setFilter('图层名', [
          '==',
          ['get', 'age'],
          11
        ]);
// 只显示age是11 12 13的部分
window.rootMap.map.setFilter('图层名', [
          'in',
          ['get', 'age'],
          11,12,13
        ]);
const list = [11,12,13];
// 只显示age是11 12 13的部分
window.rootMap.map.setFilter('图层名', [
          'match',
          ['get', 'age'],
          list.length ? list : '',
          true,
          false,
        ]);
圆的半径大小随着zoom变化,interpolate
{
    id: 'qlfl',
    type: 'circle',
    source: '...',
    'source-layer': 'data50',
    name: '分类',
    paint: {
      'circle-color': ['match', ['get', 'age'], '1', '#3E7EFF', '2', '#0DBDFF', '3', '#54C6DC',
        '4', '#74DFD4', '#74DFD4'],
      // 圆的半径大小随着zoom变化,zoom=5,半径为2,zoom=10,半径为8,
      'circle-radius': [
        'interpolate',
        ['linear'],
        ['zoom'],
        5,
        2,
        10,
        8,
      ],
    },
    layout: {
      visibility: 'none',
    },
  },
鼠标划过 获取对应的经纬度 e.lngLat
this.map.on("mousemove", (e) => {
	console.log(e.lngLat)

})
鼠标划过 线 点 获取坐标
this.map.on("mousemove", (e) => {
      const features = this.map.queryRenderedFeatures(e.point, {
        layers: ['ls-center'],
      });
      const layerName = features[0].layer.id;
      if (features.length && Object.keys(features[0].properties).length) {
      	// 鼠标划过线 ,获取坐标 coordinates
	      if(layerName === 线的图层名){
	        const geometry = features[0].geometry.coordinates;
	        coordinates = geometry[parseInt(geometry.length / 2)];
	      } else if(layerName === 点的图层名){ //  鼠标划过点 ,获取坐标 coordinates
	      	coordinates = features[0].geometry.coordinates;
	      }
      }
给点图层(circle) 加标志 Marker
 const el = document.createElement("div");
 el.className = "ql-point-marker";
 //coordinates是坐标[46.22,99.33]
 const marker = new mapboxgl.Marker(el).setLngLat(coordinates).addTo(this.map);
.mapboxgl-canvas-container {
    .qlfl-point-marker {
    	width: 32px;
   		height: 42px;
    	background-size: 100% 100%;
      	background: url(~@/assets/img/A.png) no-repeat;
    }
}
queryRenderedFeatures
// 获取指定图层(只要name为张三的点) 的坐标
coordinates = this.map.queryRenderedFeatures({ filter: ['==','name','张三'],layers: ['图层名] })[0].geometry.coordinates;
debounce 防抖
this.map.on('mousemove', debounce((e) => {
 }, 300));
指定图层层级 例如让某图层置于最上方
一、在添加时可以控制它的图层顺序:addLayer( id, beforeId )
beforeId :在现有层(beforeId)之前插入新图层(id),导致新图层(id)在现有层(beforeId)的下方显示。如果未指定此参数,该层将被附加到layers数组的末尾,并显示在所有其他层之上。
// Add a new symbol layer before an existing layer
map.addLayer({
  id: 'states',
  source: 'state-data',
  type: 'symbol',
  layout: {
    'text-field': ['get', 'name']
  }
  //在cities图层的下方添加states图层,
}, 'cities');
id:要移动的层id。
beforeId: 插入新层的现有层的ID。当查看地图时,id层将出现在beforeId层的下面。如果beforeId被省略,该层将被添加到layers数组的末尾,并出现在地图上的所有其他层之上
// point在polygon的下面
map.moveLayer('point', 'polygon');
// point1在所有图层的上面
map.moveLayer('point1');
layerList.forEach((item) => {
  // 图层位于最上方 beforeId
  this.map.addLayer(item,"图层名");
});
地图居中 fitBounds
const bounds = [[75, 35], [95, 50]]; // 新疆的经纬度范围
// 距离左侧360px 居中
window.rootMap.map.fitBounds(bounds, {
        padding: { left: 360 },
      });
地图切换2d 3d setProjection
const projection = map.getProjection();
map.setProjection('projection'); // 3d
map.setProjection('mercator');// 2d
map.setProjection({
	name: 'albers',
	center: [35, 55],
	parallels: [20, 60]
});
恢复倾斜角度setPitch,恢复旋转角度rotateTo
  window.rootMap.map.setPitch(0);
  // 恢复倾斜角度
  // window.rootMap.map.rotateTo(0);
  // 整北
  window.rootMap.map.resetNorth();
缩放 获取层级getZoom
this.map.on('zoomend', () => {
     console.log('A zoomend event occurred.', this.map.getZoom());
})
获取当前已上图的所有的图层 getStyle
this.map.getStyle()
图标稀疏
(可选,值 >= 1,默认值为 250,单位:像素。只有 symbol-placement 为 line 时才有效)
map.addLayer({
    'id': 'arrowLayer',
    'type': 'symbol',
    'source': {
      'type': 'geojson',
      'data': routeGeoJson //轨迹geojson格式数据
    },
    'layout': {
      'symbol-placement': 'line',
      'symbol-spacing': 50, // 图标间隔,默认为250
      'icon-image': 'arrowIcon', //箭头图标
      'icon-size': 0.5
    }
  });
添加标记点marker
表达式case:
'circle-color': [
'case',
['<', ['get', 'speed'], 10.8], 'rgba(0,0,0,0)', //<10.8
['<', ['get', 'speed'], 17.2], 'rgba(153, 255, 153, .9)', //>=10.8 & <17.2
['<', ['get', 'speed'], 24.5], 'rgba(102, 204, 255, .9)',
['<', ['get', 'speed'], 32.7], 'rgba(255, 255, 102, .9)',
['<=', ['get', 'speed'], 41.5], 'rgba(253, 139, 0, .9)',
['<=', ['get', 'speed'], 50.1], 'rgba(255, 51, 0, .9)', //>=41.5 & <50.1
'rgba(255, 0, 255, .9)' // 默认值, >=50.1
]
表达式step
// <=100, 100-500, >500
"circle-color": [
  "step",
  ["get", "count"],
  "#51bbd6", 100,
  "#f1f075", 500,
  "#f28cb1" // other
]

'circle-color': [
  'step',
  ['to-number', ['get', 'CID']],
  '#0098A3',  10,
  '#00CA8D', 20,
  '#37C508', 30,
  '#98F300',  40,
  '#EFFF85'
]
表达式interpolate 插值
// <=8, 8-10, >10
"background-color": [
  "interpolate",
  ["linear"],
  ["zoom"],
  8, "rgba(0, 0, 255, 0.2)",
  10, "rgba(255, 0, 0, 0.2)"
]

// <=20, 20-60, 60-100, >100
'fill-extrusion-color': [
  'interpolate',
  ['linear'],
  ['get', 'height'],
  20, 'rgba(255,255,191, 0.65)',
  60, 'rgba(253,174,97, 0.65)',
  100, "rgba(215,25,28, 0.65)"
]

// exponential,指数
"fill-opacity": [
  "interpolate",
  ["exponential", 1.5],
  ["zoom"],
  2, 0.3,
  7, 0
]
mapbox 图标动态光圈效果
设置 地图缩放 并完整展示一套线 turfjs fitBounds
const shape = {"type":"MultiLineString","coordinates":[[[87.567615,43.6785],[87.565364126,43.677922624],[87.563274099,43.677641509],[87.559408332,43.67766357],[87.538748218,43.679031072],[87.535863856,43.679404135],[87.532989509,43.680018755],[87.530016996,43.680961596],[87.527710284,43.681961296]],[[87.527710284,43.681961296],[87.52520221,43.68331117],[87.522849077,43.685004075],[87.520982731,43.68673738],[87.519247277,43.688888425]]]}

var bbox = turf.bbox(shape);
const v3 = [
  [bbox[0], bbox[1]],
  [bbox[2], bbox[3]],
];

this.map.fitBounds(v3, {
  padding: { left:0 },
});
聚合(cluster)效果
map.addSource('poidata', {
    type: 'geojson',
     data: 'data/poicluster.geojson',
     cluster: true,
     //最大的聚合级别,超过级别不进行聚合
     clusterMaxZoom: 12,
    //聚合的半径,单位是像素
     clusterRadius: 80,
    //最小聚合的点数量
     clusterMinPoints:2
 });
在数据源设置聚合后,mapbox-gl会在数据源中,自动添加一个point_count属性,所以,在geojson源数据的属性中,要保持不要重名。
//添加聚合的圆圈效果,图层过滤中,显示有point_count属性的数据
	map.addLayer({
		id: 'clusters',
		type: 'circle',
		source: 'poidata',
		filter: ['has', 'point_count'],
		paint: {
		//根据聚合点数量显示不同颜色
		   'circle-color': [
		       'step',
		       ['get', 'point_count'],
		       '#51bbd6',
		       100,
		       '#f1f075',
		       750,
		       '#f28cb1'
		   ],
		//根据聚合点数量显示不同半径圆
		   'circle-radius': [
		       'step',
		       ['get', 'point_count'],
		       20,
		       100,
		       30,
		       750,
		       40
		   ]
		}
	});
	//添加聚合的点数量,取point_count属性值,或者point_count_abbreviated,显示缩写值,如3k等
	map.addLayer({
		id: 'cluster-count',
		type: 'symbol',
		source: 'poidata',
		filter: ['has', 'point_count'],
		layout: {
		   'text-field': '{point_count}',
		   'text-font': ['Arial Unicode MS Bold'],
		   'text-size': 12
		}
	});
	//显示未聚合的点图层
	map.addLayer({
		id: 'unclustered-point',
		type: 'circle',
		source: 'poidata',
		filter: ['!', ['has', 'point_count']],
		paint: {
		   'circle-color': '#ffff00',
		   'circle-radius': 4,
		   'circle-stroke-width': 1,
		   'circle-stroke-color': '#fff'
		}
	});
图标加动态光圈效果
参考:https://docs.mapbox.com/mapbox–gl–js/example/add-image-animated/

	// TO MAKE THE MAP APPEAR YOU MUST
	// ADD YOUR ACCESS TOKEN FROM
	// https://account.mapbox.com
	mapboxgl.accessToken = 'YOUR_MAPBOX_ACCESS_TOKEN';
    const map = new mapboxgl.Map({
        container: 'map',
        center: [0, 0],
        zoom: 2,
        // Choose from Mapbox's core styles, or make your own style with Mapbox Studio
        style: 'mapbox://styles/mapbox/streets-v12'
    });

    const size = 200;

    // This implements `StyleImageInterface`
    // to draw a pulsing dot icon on the map.
    const pulsingDot = {
        width: size,
        height: size,
        data: new Uint8Array(size * size * 4),

        // When the layer is added to the map,
        // get the rendering context for the map canvas.
        onAdd: function () {
            const canvas = document.createElement('canvas');
            canvas.width = this.width;
            canvas.height = this.height;
            this.context = canvas.getContext('2d');
        },

        // Call once before every frame where the icon will be used.
        render: function () {
            const duration = 1000;
            const t = (performance.now() % duration) / duration;

            const radius = (size / 2) * 0.3;
            const outerRadius = (size / 2) * 0.7 * t + radius;
            const context = this.context;

            // Draw the outer circle.
            context.clearRect(0, 0, this.width, this.height);
            context.beginPath();
            context.arc(
                this.width / 2,
                this.height / 2,
                outerRadius,
                0,
                Math.PI * 2
            );
            context.fillStyle = `rgba(255, 200, 200, ${1 - t})`;
            context.fill();

            // Draw the inner circle.
            context.beginPath();
            context.arc(
                this.width / 2,
                this.height / 2,
                radius,
                0,
                Math.PI * 2
            );
            context.fillStyle = 'rgba(255, 100, 100, 1)';
            context.strokeStyle = 'white';
            context.lineWidth = 2 + 4 * (1 - t);
            context.fill();
            context.stroke();

            // Update this image's data with data from the canvas.
            this.data = context.getImageData(
                0,
                0,
                this.width,
                this.height
            ).data;

            // Continuously repaint the map, resulting
            // in the smooth animation of the dot.
            map.triggerRepaint();

            // Return `true` to let the map know that the image was updated.
            return true;
        }
    };

    map.on('load', () => {
        map.addImage('pulsing-dot', pulsingDot, { pixelRatio: 2 });

        map.addSource('dot-point', {
            'type': 'geojson',
            'data': {
                'type': 'FeatureCollection',
                'features': [
                    {
                        'type': 'Feature',
                        'geometry': {
                            'type': 'Point',
                            'coordinates': [0, 0] // icon position [lng, lat]
                        }
                    }
                ]
            }
        });
        map.addLayer({
            'id': 'layer-with-pulsing-dot',
            'type': 'symbol',
            'source': 'dot-point',
            'layout': {
                'icon-image': 'pulsing-dot'
            }
        });
    });
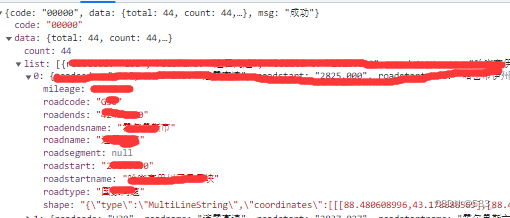
mapbox-gl Invalid string length
addSouce(datas) {
	 const qesArr = [];
	 qesArr.push({
	   type: 'Feature',
	   properties: { types: 'name', ...datas },
	   geometry: JSON.parse(datas),
	 });

	 this.map.getSource('图层名').setData({
	   type: 'FeatureCollection',
	   features: qesArr,
	 });
	this.map.setLayoutProperty('图层名', 'visibility', 'visible');
 }
"{"type":"MultiLineString","coordinates":[[[87.567212262,43.677115837],[87.567209693,43.677096688]],[[77.613333333,38.899144917],[77.612972767,38.902536574]],......]}"
popup自定义类名
var popup = new mapboxgl.Popup({className: 'my-class'})
  .setLngLat(e.lngLat)
  .setHTML("<h1>Hello World!</h1>")
  .setMaxWidth("300px")
  .addTo(map);
to-number
"line-color": ["step", ["to-number", ["get", "mqi"]], "#ffea1f", 60, "#ffdf5c", 70, "#ffcd2e", 80, "#fdb346", 90, '#f4a02a'],
参考:
mapbox地图弹窗(popup)使用vue组件,实现弹窗样式轻松自定义化
原文地址:https://blog.csdn.net/qq_14993591/article/details/125373902
本文来自互联网用户投稿,该文观点仅代表作者本人,不代表本站立场。本站仅提供信息存储空间服务,不拥有所有权,不承担相关法律责任。
如若转载,请注明出处:http://www.7code.cn/show_28690.html
如若内容造成侵权/违法违规/事实不符,请联系代码007邮箱:suwngjj01@126.com进行投诉反馈,一经查实,立即删除!
主题授权提示:请在后台主题设置-主题授权-激活主题的正版授权,授权购买:RiTheme官网
声明:本站所有文章,如无特殊说明或标注,均为本站原创发布。任何个人或组织,在未征得本站同意时,禁止复制、盗用、采集、发布本站内容到任何网站、书籍等各类媒体平台。如若本站内容侵犯了原著者的合法权益,可联系我们进行处理。