本文介绍: Wijmo is a complete collection of extensible, fast JavaScript UI components written in TypeScript. The framework–agnostic Wijmo components include first–class support for top frameworks including Angular, React, Vue and Web Components
Enhance Analytics with Angular Chart Trend Lines
Provide a visual representation of the overall direction of chart data, helping users identify trends and patterns.
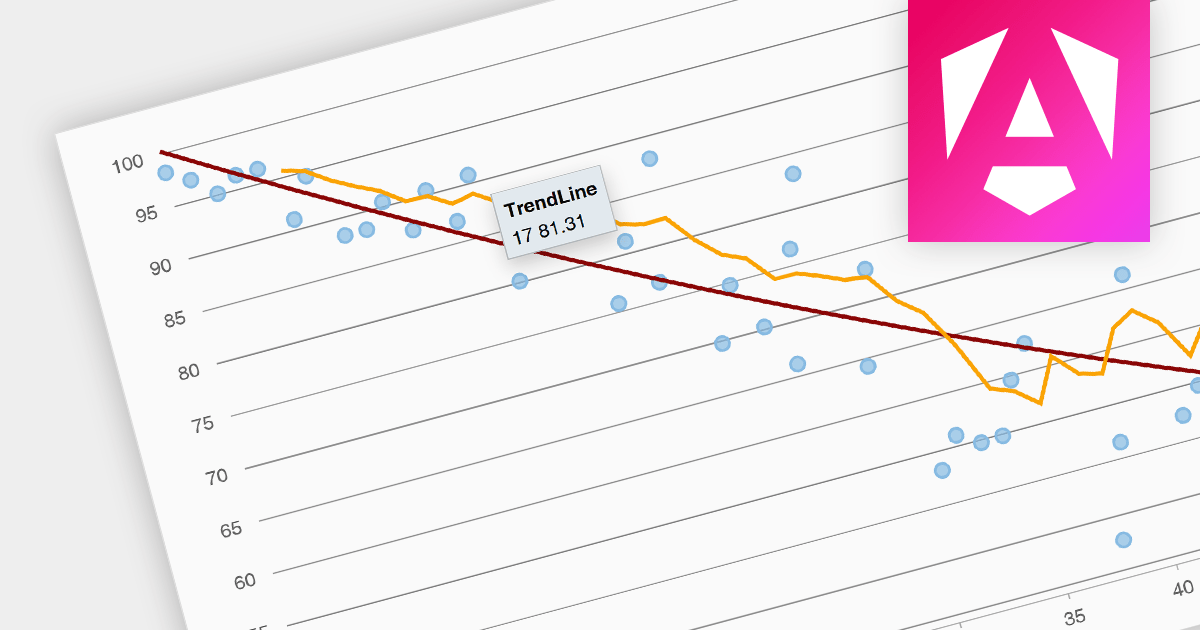
Trend lines are a chart feature used to indicate patterns or trends in data over time. Common examples include linear, exponential, polynomial, logarithmic, and moving average. Trend lines are crucial for making predictions or understanding the direction of data points in scatter plots and line charts, helping make data–driven decisions.
Several Angular chart components provide trend line support including:


声明:本站所有文章,如无特殊说明或标注,均为本站原创发布。任何个人或组织,在未征得本站同意时,禁止复制、盗用、采集、发布本站内容到任何网站、书籍等各类媒体平台。如若本站内容侵犯了原著者的合法权益,可联系我们进行处理。