本文介绍: vue3.0 + typescript openlayers实现地图标点、移动、画线、显示范围、测量长度、测量面积、画三角形、画正方形、画圆、线选、画笔、清除测量、清除、地图上展示弹窗等功能
vue3.0 + typescript openlayers实现地图标点、移动、画线、显示范围、测量长度、测量面积、画三角形、画正方形、画圆、线选、画笔、清除测量、清除地图所有等功能
由于最近项目中用到了地图,所以今天有时间把代码摘出来,自己写个地图的小demo标记下
话不多说,先看效果:
map1
npm i ol@6.14.1
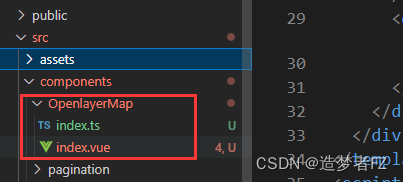
2、下面是OpenlayerMap/index.vue(地图)的代码,记得申请地图得key,记得填到下方的代码中
<template>
<div class="openlayersMap">
<div id="map"></div>
<!-- 鼠标经纬度指示 -->
<div
id="mouse-position"
:style="assignMouseIndicatePosition"
v-if="needMouseIndicate"
></div>
<!-- 图层上展示的弹窗 -->
<div id="popup-box">
<!-- <span id="popup-closer">✖</span> -->
<div id="popup-content">
<slot :value="sol"></slot>
</div>
</div>
<div id="popup-box-right" :style="{top:'-90px',left:'5px'}">
<hr :style="{border: '2px solid #2af0e1',borderRadius: '40px',width:'2vw',marginTop:'80px'}"/>
<div id="popup-content">
<slot name="right" :value="sol">
</slot>
</div>
</div>
</div>
</template>
<script lang="ts" setup>
import { ref, reactive, onMounted, nextTick } from "vue";
import { getTopLeft, getWidth } from "ol/extent";
import { getArea, getLength } from "ol/sphere";
import { Map, View, Feature, Overlay } from "ol";
import { Draw, Modify, Snap } from "ol/interaction";
import { Circle as CircleGeo } from "ol/geom";
import { Circle, Fill, Stroke, Style, Text, Icon } from "ol/style";
import { Tile, Vector as VectorLayer } from "ol/layer";
import { defaults, MousePosition } from "ol/control";
import { get, fromLonLat } from "ol/proj";
import WMTSTileGrid from "ol/tilegrid/WMTS";
import { createStringXY } from "ol/coordinate";
import { WMTS, Vector as VectorSource } from "ol/source";
import { LineString, Point, Polygon } from "ol/geom";
import { createBox, createRegularPolygon } from "ol/interaction/Draw";
import CircleStyle from "ol/style/Circle";
import { unByKey } from "ol/Observable";
const startImg: any = require("@/image/startPoint.png"); //轨迹起点图标
const endImg: any = require("@/image/endPoint.png"); //轨迹终点图标
// 是否显示地图的经纬度指示
const props = withDefaults(defineProps<{ needMouseIndicate: boolean }>(), {
needMouseIndicate: true
});
const modelMange: String='';
let sol: any = ref(null); // 插槽回填数据
let assignMouseIndicatePosition: IMosueIndicatePosition;
let drawSource: VectorSource;
let drawVector: any = null;
let exportDrawVector: any = ref(null);
let map: Map | undefined = undefined;
const exportMap =ref<any>(null)
let saveVectorLayer: any | null = null;
let mousePositionControl: MousePosition;
const layerObj: any=ref(null);
const isActivePopup:any=ref(false);
const singleLayer:any=ref(null);
const saveGroupLayer:any=ref(null); //图形Layer
const draw:any=ref(null); //画笔
const drawList:any=ref([]); //
const snap:any=ref(null); //
const state=reactive<any>({
shapeType:'',
layerIndex:0,
drawCache:[],
helpTooltip:'',
continueLineMsg:'',
helpTooltipElement:null,
measureTooltipElement:null,
measureTooltip:null,
sketch:null,
listener:null,
//路径相关
routeMap:[],
})
/**
* 在地图上绘制图层
*/
//#region
const initDrawSource = () => {
drawSource = new VectorSource();
drawVector = new VectorLayer({
source: drawSource,
style: new Style({
fill: new Fill({
color: "rgba(255, 255, 255, 0.2)",
}),
stroke: new Stroke({
color: "#ffcc33",
width: 2,
}),
image: new Circle({
radius: 7,
fill: new Fill({
color: "#ffcc33",
}),
}),
}),
});
exportDrawVector.value=drawVector
const modify = new Modify({ source: drawSource });
// exportMap.value.addInteraction(modify)
return modify;
};
// 得到初始化地图控制器
function getIninialControl(mouseInfoTargetId: string = "mouse-position") {
if (props.needMouseIndicate) {
mousePositionControl = new MousePosition({
coordinateFormat: createStringXY(5),
projection: "EPSG:4326",
className: "custom-mouse-position",
target: document.getElementById(mouseInfoTargetId) || undefined,
undefinedHTML: " ",
});
return defaults({ zoom: false, rotate: false }).extend([
mousePositionControl,
// 全屏插件
// new FullScreen(),
]);
} else {
return defaults({ zoom: false, rotate: false });
}
}
// 地图初始化
const initMap=()=>{
try {
let projection: any = get("EPSG:4326");
let projectionExtent = projection!.getExtent();
let size = getWidth(projectionExtent) / 256;
let resolutions = new Array(18);
let matrixIds = new Array(18);
const modify = initDrawSource();
for (let i = 1; i <= 18; i++) {
resolutions[i] = size / Math.pow(2, i);
matrixIds[i] = i;
}
map = new Map({
controls: getIninialControl(),
layers: [
// 卫星图层数据
new Tile({
source: new WMTS({
url: "http://t{0-7}.tianditu.gov.cn/img_c/wmts?tk=你的KEY",//这里是你申请的key
layer: "img",
style: "default",
matrixSet: "c",
projection: projection,
format: "tiles",
tileGrid: new WMTSTileGrid({
origin: getTopLeft(projectionExtent),
resolutions: resolutions,
matrixIds: matrixIds,
}),
wrapX: true,
}),
}),
// 卫星行政数据
new Tile({
source: new WMTS({
url: "http://t{0-7}.tianditu.gov.cn/cia_c/wmts?tk=你的KEY",//这里是你申请的key
layer: "cia", //vec/cva img/cia
matrixSet: "c",
format: "tiles",
style: "default",
projection: projection,
tileGrid: new WMTSTileGrid({
origin: getTopLeft(projectionExtent),
resolutions: resolutions,
matrixIds: matrixIds,
}),
wrapX: true,
}),
}),
drawVector,
],
target: "map",
view: new View({
center: [108.8821,34.2227], // 初始化中心点 西安软件园
maxZoom: 18,
minZoom: 8,
zoom: 15,//地图层级
projection: "EPSG:4326",
}),
});
exportMap.value=map
map.addInteraction(modify);
} catch (err) {
console.log(err);
}
}
// 在页面上展示点
const lastShowPoints= (dataList: any[], imgStr: string,scale: number=1,fn?: any,)=>{
if (dataList.length === 0) return;
try {
let features: any[] = []; // 定义坐标s
imgStr =require(`../../image/${imgStr}`);
let vectorLayer = new VectorLayer({
renderBuffer: 200,
source: new VectorSource(),
style: (feature) => [
new Style({
image: new Icon({
src: imgStr,
scale: scale,
// imgSize: [50, 50],
}),
}),
],
});
// console.log('points',dataList);
dataList.forEach((item) => {
item.sol = fn(JSON.parse(JSON.stringify(item)));
if ((item.lng || item.longitude) && (item.lat || item.latitude)) {
let newObj = Object.assign({}, item);
const wz=[+item.lng?item.lng:item.longitude, +item.lat?item.lat:item.latitude];
// console.log('wz',wz);
newObj.geometry = new Point(wz);
features.push(new Feature(newObj));
if(item.sol.circle){
let circleFeature = new Feature({ //添加面
geometry: new CircleGeo([wz[0]*1,wz[1]*1], 0.005)
});
circleFeature.setStyle(new Style({ // 设置样式
fill: new Fill({
color: 'rgba(255, 255, 255, 0.1)'
}),
stroke: new Stroke({
color: 'rgba(217, 11, 53, 0.4)',
lineDash: [20, 10]
})
}));
features.push(circleFeature);
}
}
});
vectorLayer.getSource()!.addFeatures(features);
map!.addLayer(vectorLayer);
saveVectorLayer=vectorLayer
return saveVectorLayer
} catch (error) {
console.log(error);
}
}
//点数组绘图
const groupPlot=(data:any,color?:string,borderColor?:string)=>{
console.log(color);
color=color || "rgba(252, 51, 40, 0.2700)"
let source = new VectorSource();
let style = new Style({
text: new Text({
// font: '15px Microsoft YaHei',
// text:'xxxx',
fill: new Fill({
color: '#fff'
})
}),
fill: new Fill({
color
}),
stroke: new Stroke({
color: borderColor || 'rgba(252, 51, 40, 1)',
width: 2
}),
image: new Circle({
radius: 10,
fill: new Fill({
color: '#ffcc33'
})
})
});
//矢量图层
let vectorLayer = new VectorLayer({
source: source,
style: style,
});
let features: any[] = [];
//多边形要素类
data.map((n:any)=>{
//声明一个新的数组
let coordinatesPolygon = new Array();
//循环遍历将经纬度转到"EPSG:4326"投影坐标系下
for (let i = 0; i < n.pointList.length; i++) {
let pointTransform = fromLonLat([n.pointList[i][0], n.pointList[i][1]], "EPSG:4326");
coordinatesPolygon.push(pointTransform);
}
let feature = new Feature({
...n,
geometry: new Polygon([coordinatesPolygon]),//多边形此处注意一定要是[坐标数组]
});
features.push(feature)
})
source.addFeatures(features);
map!.addLayer(vectorLayer);
saveGroupLayer.value=vectorLayer;
return vectorLayer
}
// 点击地图后的交互(主要是图标)
const mapClick=()=>{
map!.on("click", (event) => {
console.log(784,event)
removeModel();
let bool=true;
let pixel =map!.getEventPixel(event.originalEvent);
map?.forEachFeatureAtPixel(pixel, (feature: any,a) => {
try {
let myfeature;
if(feature.values_.features){//聚合点击
myfeature=feature.values_.features[0];
}else{
myfeature=feature;
}
// console.log('myfeature',myfeature);
if(!myfeature.values_.sol) return
sol.value=myfeature.values_.sol;
console.log('sol',sol.value)
// console.log('sol',sol.value || myfeature.values_);
let x = myfeature.get("longitude") || myfeature.get("lng"),
y = myfeature.get("latitude") || myfeature.get("lat");
let coordinate = [x, y];
//来控制弹框样式
let popupClass="popup-box"; //popup-box-right
if(sol.value.popupClass) popupClass=sol.value.popupClass
//来控制弹框边距样式
// this.modelMangebottom=this.sol.bottom || '0';
// this.modelMangeleft=this.sol.left || '0';
let overlay = new Overlay({
element: document.getElementById(popupClass) || undefined,
});
map!.addOverlay(overlay);
overlay.setPosition(coordinate);
layerObj.value = overlay;
bool=false
isActivePopup.value=true;
} catch (error) {
console.log(error);
}
});
// if((this.$parent as any).isPopup && (this.$parent as any).isPopup.length>0) (this.$parent as any).isPopup=[];
if(bool) map!.removeLayer(singleLayer.value);
});
}
//清除已打开的弹框
const removeModel=()=>{
if(isActivePopup.value){
layerObj.value.setPosition(undefined);
sol.value = {};
layerObj.value=null;
isActivePopup.value=false
}
}
// 移动到指定中心点位
const moveToPoint=async (x: number, y: number)=>{
// console.log(x,y);
map!.getView().animate({
center: [x, y],
});
}
//画线
const drawLine=(bool:boolean)=>{
draw.value && map!.removeInteraction(draw.value);
draw.value = new Draw({
source:drawVector.getSource(),
type: "LineString",
freehand: bool,
stopClick: true,
});
exportMap.value.addInteraction(draw.value);
draw.value && draw.value.on('drawend',() =>drawList.value.push(draw.value))
// console.log('drawVector',drawVector);
return draw.value;
}
// 多边形
const drawPolygon=()=>{
draw.value && map!.removeInteraction(draw.value);
draw.value = new Draw({
source: drawVector.getSource(),
type: "Polygon",
stopClick: true,
});
exportMap.value.addInteraction(draw.value);
draw.value && draw.value.on('drawend',() =>drawList.value.push(draw.value))
}
// 画圆
const drawCircle=(type:string)=>{
draw.value && map!.removeInteraction(draw.value);
if (type == "triangle") {
//正三角
draw.value = new Draw({
source: drawVector.getSource(),
type: "Circle",
geometryFunction: createRegularPolygon(3),
stopClick: true,
});
} else if (type == "circle") {
draw.value = new Draw({
//正圆
source: drawVector.getSource(),
type: "Circle",
stopClick: true,
});
} else if (type == "square") {
draw.value = new Draw({
//正方形
source: drawVector.getSource(),
type: "Circle",
geometryFunction: createRegularPolygon(4),
stopClick: true,
});
} else if (type == "rectangle") {
draw.value = new Draw({
//长方形
source: drawVector.getSource(),
type: "Circle",
geometryFunction: createBox(),
stopClick: true,
});
}
snap.value = new Snap({source: drawSource });
exportMap.value.addInteraction(snap.value); //鼠标捕捉
exportMap.value.addInteraction(draw.value);
draw.value && draw.value.on('drawend',() =>drawList.value.push(draw.value))
}
/** 测距、测面*/
const measure=(type:string)=>{
draw.value && exportMap.value.removeInteraction(draw.value);
state.shapeType = type;
state.layerIndex++;
state.drawCache[state.layerIndex] = {
feature: null,
measureTooltip: null,
};
if (draw.value) {
exportMap.value.removeInteraction(draw.value);
}
// 添加map事件
addMapEvent();
}
const addMapEvent=()=>{
exportMap.value.on("pointermove", (evt:any) => {
draw.value? pointerMoveHandler(evt): exportMap.value.removeOverlay(state.helpTooltip);
});
exportMap.value.getViewport().addEventListener("mouseout", () => {
state.helpTooltipElement &&
state.helpTooltipElement.classList.add("hidden");
});
addInteraction();
}
const addInteraction=()=> {
draw.value = new Draw({
source: drawVector.getSource(),
type: state.shapeType,
style: new Style({
fill: new Fill({ color: "rgba(255, 255, 255, 0.2)" }),
stroke: new Stroke({
color: "rgba(255, 255, 255, 1)",
lineDash: [10, 10],
width: 2,
}),
image: new CircleStyle({
radius: 5,
stroke: new Stroke({ color: "rgba(255, 255, 255, 0.8)" }),
fill: new Fill({ color: "rgba(255, 255, 255, 0.2)" }),
}),
}),
});
exportMap.value.addInteraction(draw.value);
createMeasureTooltip();
createHelpTooltip();
drawHandler();
}
const createMeasureTooltip=()=>{
if(state.measureTooltipElement) {
state.measureTooltipElement.parentNode.removeChild(
state.measureTooltipElement
);
}
state.measureTooltipElement = document.createElement("div");
state.measureTooltipElement.className = "ol-tooltip ol-tooltip-measure";
state.measureTooltip = new Overlay({
element: state.measureTooltipElement,
offset: [0, -15],
positioning: "bottom-center",
});
exportMap.value.addOverlay(state.measureTooltip);
}
const createHelpTooltip=()=>{
if (state.helpTooltipElement) {
state.helpTooltipElement.parentNode.removeChild(state.helpTooltipElement);
}
state.helpTooltipElement = document.createElement("div");
state.helpTooltipElement.className = "ol-tooltip hidden";
state.helpTooltip = new Overlay({
element: state.helpTooltipElement,
offset: [15, 0],
positioning: "center-left",
});
exportMap.value.addOverlay(state.helpTooltip);
}
const drawHandler=()=>{
draw.value.on("drawstart", (evt:any) => {
state.sketch = evt.feature;
let tooltipCoord = evt.coordinate;
state.listener = state.sketch.getGeometry().on("change", (evt:any) => {
let output;
const geom = evt.target;
if (geom instanceof LineString) {
output = formatLength(geom);
tooltipCoord = geom.getLastCoordinate();
} else if (geom instanceof Polygon) {
output = formatArea(geom);
tooltipCoord = geom.getInteriorPoint().getCoordinates();
}
let closeBtn =
"<i class='tooltip-close-btn tooltip-close-btn_" +
state.layerIndex +
"' data-index='" +
state.layerIndex +
"'></i>";
state.measureTooltipElement.innerHTML = output + closeBtn;
state.measureTooltip.setPosition(tooltipCoord);
state.drawCache[state.layerIndex].measureTooltip = state.measureTooltip;
});
});
draw.value.on("drawend", (evt:any) => {
// console.log('hhhh');
// (this.$parent as any).toolsindex ='';
state.drawCache[state.layerIndex].feature = evt.feature;
state.measureTooltipElement.className = "ol-tooltip ol-tooltip-static";
state.measureTooltip.setOffset([0, -7]);
state.sketch = null;
state.measureTooltipElement = null;
createMeasureTooltip();
unByKey(state.listener);
exportMap.value.removeInteraction(draw.value);
draw.value = null;
// 删除图层
const self = this;
document?.querySelector(".tooltip-close-btn_" + state.layerIndex).addEventListener("click", function (e:any) {
// console.log('dataset',e);
// state.drawVector
// .getSource()
// .removeFeature(state.drawCache[state.dataset.index].feature);
// state.map.removeOverlay(
// state.drawCache[state.dataset.index].measureTooltip
// );
// delete state.drawCache[state.dataset.index];
});
});
}
const formatLength=(line:any)=>{
const sourceProj = exportMap.value.getView().getProjection(); //获取投影坐标系
var length = getLength(line, { projection: sourceProj });
var output;
if (length > 100) {
output = Math.round((length / 1000) * 100) / 100 + " " + "km";
} else {
output = Math.round(length * 100) / 100 + " " + "m";
}
return output;
}
const formatArea=(polygon:any)=>{
const sourceProj = exportMap.value.getView().getProjection(); //获取投影坐标系
const geom = polygon.clone().transform(sourceProj, "EPSG:3857");
const area = getArea(geom);
let output;
if (area > 10000) {
output =
Math.round((area / 1000000) * 100) / 100 + " " + "km<sup>2</sup>";
} else {
output = Math.round(area * 100) / 100 + " " + "m<sup>2</sup>";
}
return output;
}
const pointerMoveHandler=(evt:any)=>{
if (evt.dragging) {
return;
}
/** @type {string} */
var helpMsg = "测量";
if (state.sketch) {
var geom = state.sketch.getGeometry();
if (geom instanceof LineString) {
helpMsg = state.continueLineMsg;
}
}
state.helpTooltipElement.innerHTML = helpMsg;
state.helpTooltip.setPosition(evt.coordinate);
state.helpTooltipElement.classList.remove("hidden");
}
// **************
//路径相关
// 开始显示一条轨迹
const showWay=async(_routeInfo: IRouteInfo)=>{
if (state.routeMap.some((route:any) => route.id === _routeInfo.id)) {
// 已经有了路径,直接移动视野到该点
moveToPoint(_routeInfo.gis[0][0], _routeInfo.gis[0][1]);
return;
}
// 根据一系列点设置地图视野中点
const point = _routeInfo.gis[0];
// 将地图设置到最大缩放度
const view = map!.getView();
const MaxZoom = view.getMaxZoom();
const MinZoom = view.getMinZoom();
const zoom = Math.ceil((MaxZoom + MinZoom) / 2);
view.setZoom(zoom);
await moveToPoint(point[0], point[1]);
showRouterMap(_routeInfo);
}
// 路径显示
const showRouterMap=(_routeInfo: any)=>{
let pointsList = _routeInfo.gis;
// pointsList.map(n=>{
// n=[1*n[0],1*n[1]]
// })
let roadLine = new LineString(pointsList);
let output=formatLength(roadLine)
console.log('output',pointsList,output);
let roadLineSource = new VectorSource({
features: [new Feature(roadLine)],
});
const roadLineLayer = new VectorLayer({
source: roadLineSource,
style: new Style({
stroke: new Stroke({
color: "#38A0FF",
width: 4,
}),
}),
});
map!.addLayer(roadLineLayer);
let pointLayer1 = addVectorLabel({
pointsList: pointsList[0],
txt: "起",
});
let pointLayer2 = addVectorLabel({
pointsList: pointsList[pointsList.length - 1],
txt: "终",
});
let label = addVectorLabel({
pointsList: [pointsList[0][0], pointsList[0][1]],
txt: _routeInfo.name + ",全程" + output,
fill: "#111111",
stroke: "#ffffff",
});
// 保存实例
state.routeMap.push({
id: _routeInfo.id as string,
routeLayerExample: roadLineLayer,
vectorLabels: [label],
points: [pointLayer1, pointLayer2],
});
}
// 添加矢量标签(例如路径的起终点、描述)
const addVectorLabel=(opt: any)=>{
let vectorSource = new VectorSource(); //矢量标注的数据源
const layer = new VectorLayer({
source: vectorSource,
}); //矢量标注图层
map!.addLayer(layer);
if (opt.txt == "起" || opt.txt == "终") {
// 添加起点以及终点的layer
let newFeature = new Feature({
geometry: new Point(opt.pointsList || []),
});
newFeature.setStyle(
new Style({
image: new Icon({
src: opt.txt == "起" ? startImg : endImg,
offset: [0, -26],
offsetOrigin: "bottom-right",
size: [32, 60],
}),
fill: new Fill({ color: "#ffffff" }),
zIndex: 1,
})
);
// 将新要素添加到数据源中
vectorSource.addFeature(newFeature);
return layer;
}
let overlayerElement = document.createElement("div");
overlayerElement.className = "ol-tooltip-draw-route";
overlayerElement.innerHTML = opt.txt;
const overlayObj = new Overlay({
element: overlayerElement,
offset: [0, -30],
positioning: "bottom-center",
});
overlayObj.setPosition(opt.pointsList);
map!.addOverlay(overlayObj);
return overlayObj;
}
// 清除部分路径
const clearRoute=(_routeId: number|string | Array<number|string>)=>{
if (Array.isArray(_routeId)) {
for (let routeId of _routeId) {
let routeWayIndex = state.routeMap.findIndex((it:any)=>it.id == routeId)
let routeItem = state.routeMap[routeWayIndex]
// console.log('routeItem',routeItem,state.routeMap,routeId);
exportMap.value.removeLayer(routeItem.routeLayerExample);
routeItem.points?.forEach((it:any) => exportMap.value.removeLayer(it));
routeItem.vectorLabels.forEach((it:any) => exportMap.value.removeOverlay(it));
state.routeMap.splice(routeWayIndex, 1);
}
} else {
if (!_routeId) return;
let routeWayIndex = state.routeMap.findIndex((it:any)=>it.id == _routeId)
let routeItem = state.routeMap[routeWayIndex]
exportMap.value.removeLayer(routeItem.routeLayerExample);
routeItem.points?.forEach((it:any) => exportMap.value.removeLayer(it));
routeItem.vectorLabels.forEach((it:any) => exportMap.value.removeOverlay(it));
state.routeMap.splice(routeWayIndex, 1);
}
}
nextTick(()=>{
})
defineExpose({measure,removeModel,lastShowPoints,groupPlot,moveToPoint,exportMap,drawLine,drawPolygon,drawCircle,draw,exportDrawVector,state,showWay,clearRoute})
onMounted(() => {
initMap();
mapClick()
});
</script>
<style lang="scss" scoped>
.openlayersMap {
width: 100%;
height: 100%;
#map {
height: 100%;
}
#mouse-position {
position: absolute;
top: 10px;
right: 20px;
color: #fff;
font-weight: bold;
font-size: 18px;
}
#popup-box{
bottom: 25px;
left: 0px;
background-color: rgba(0, 0, 1, 0.5);
box-shadow: 0 1px 4px rgba(0, 0, 0, 0.2);
}
#popup-box ,#popup-box-right{
position: absolute;
z-index: -1;
box-sizing: border-box;
padding: 4px 6px;
border-radius: 4px;
border: 2px solid #84f199;
min-width: 280px;
position: absolute;
// bottom: 20px;
// left: -50px;
#popup-closer {
font-size: 14px;
height: 20px;
line-height: 20px;
text-align: right;
position: absolute;
right: 0;
top: 0;
margin-right: 4px;
user-select: none;
cursor: pointer;
color: #fff;
}
#popup-content {
// margin-top: 24px;
display: flex;
max-height: 600px;
// overflow-y: scroll;
position: relative;
}
&:after,
&:before {
top: 100%;
border: solid transparent;
content: " ";
height: 0;
width: 0;
position: absolute;
pointer-events: none;
}
&:after {
border-top-color: white;
border-width: 10px;
left: 48px;
margin-left: -10px;
}
&:before {
border-top-color: #cccccc;
border-width: 11px;
left: 48px;
margin-left: -11px;
}
}
#popup-box-right{
// bottom: -24vh;
// left: 2vh;
border: none;
display: flex;
&:after,
&:before {content:none;}
> #popup-content{
background: url("~@/image/chart.png") no-repeat;
background-size: 100% 100%;
}
}
}
</style>
3、下面是OpenlayerMap/index.ts的代码
import OpenLayerMap from "./index.vue"

export {
    OpenLayerMap
}
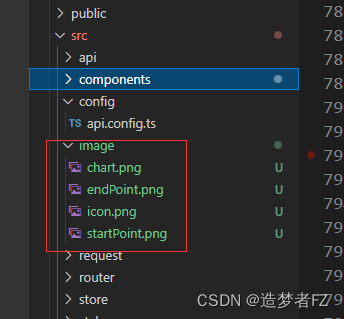
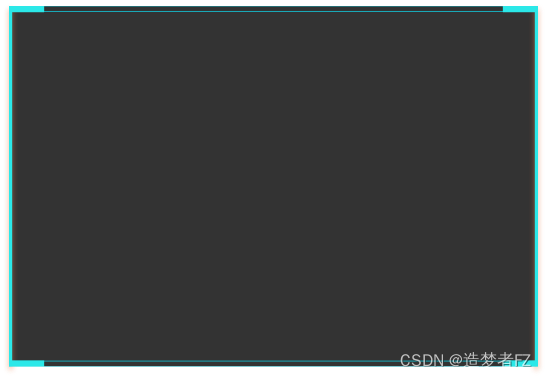
4、这是我地图中用到的三张图片,chart.png是地图上弹窗的背景图。icon.png是个标点的小图标,剩下两个是地图画轨迹时一个起点和终点的图标,如果你粘贴我的代码,没这几张图片会报错
把几张图片分别给大家贴出来吧:
chart.png
endPoint.png

startPoint.png

icon.png

import { createApp } from 'vue'
import App from './App.vue'
import router from './router'
import store from './store'
import Antd from 'ant-design-vue';
import 'ant-design-vue/dist/antd.css';
//引入地图
import components from "@/components/index";
let app=createApp(App)
Object.values(components).forEach((com) => {
  app.use(com);
});
app.use(store).use(router).use(Antd).mount('#app')
6、页面代码
<template>
  <div class="Box">
    <div class="homeBox">
      <div class="leftBox">
        <a-button type="primary" @click="showIcon">在地图上显示点</a-button
        ><br /><br />
        <a-button type="primary" @click="moveXiAn([108.9423, 34.261])"
          >移动到西安钟楼</a-button
        ><br /><br />
        <a-button type="primary" @click="moveXiAn([108.8821, 34.2227])"
          >移动到初始点</a-button
        ><br /><br />
        <a-button type="primary" @click="trajectory">显示一段轨迹</a-button
        ><br /><br />
        <a-button type="primary" @click="clearTrajectory"
          >清除上面的轨迹</a-button
        ><br /><br />
        <a-button type="primary" @click="range">显示范围</a-button><br /><br />
      </div>
      <!-- 地图 -->
      <section class="map-wrap">
        <OpenlayerMap
          ref="mapRef"
          :assignMouseIndicatePosition="{
            zIndex: 1,
            right: '83px',
            top: '14px',
            fontSize: '16px',
            fontWeight: '400',
            color: '#fff',
          }"
        >
          <!-- 地图弹框 -->
          <template #right="sol">
            <div :style="{ width: '0vh' }"></div>
            <div>
              <div class="map_right" v-if="sol.value?.showLength">
                <div v-for="(item, l) in sol.value.show" :key="l">
                  <span v-for="(n, i) in item" :key="i">{{ n }}</span>
                </div>
                <button v-if="sol.value.button">
                  {{ sol.value.buttonText ? sol.value.buttonText : "查看" }}
                </button>
              </div>
              <div class="map_right" v-else>
                <span v-for="(n, i) in sol.value?.show" :key="i">{{ n }}</span>
                <button v-if="sol.value?.button">
                  {{ sol.value.buttonText ? sol.value.buttonText : "查看" }}
                </button>
              </div>
            </div>
          </template>
        </OpenlayerMap>
        <!-- 工具箱 -->
        <div class="work-box">
          <div class="tool">
            <div v-for="(n, i) in toolData" :key="i">
              <span>{{ n.title }}</span>
              <div>
                <span
                  :style="{ color: toolsindex == `${i}${l}` ? '#409EFF' : '' }"
                  v-for="(e, l) in n.data"
                  :key="l"
                  @click="clickTool(e, i, l)"
                  >{{ e.title }}</span
                >
              </div>
            </div>
          </div>
        </div>
      </section>
    </div>
  </div>
</template>

<script lang="ts" setup>
import { defineComponent, reactive, ref, onMounted, nextTick } from "vue";
const mapRef = ref<null | HTMLElement>(null);

const data = ref<any>([
  {
    id: 14,
    name: "张三",
    longitude: "108.8821",
    latitude: "34.2227",
    pointList: [
      [108.8646, 34.2136],
      [108.8695, 34.2134],
      [108.8647, 34.2187],
    ],
  },
  {
    id: 14,
    name: "李四",
    longitude: "108.8867",
    latitude: "34.2283",
    pointList: [
      [108.8943, 34.2149],
      [108.8951, 34.2127],
      [108.8909, 34.2135],
      [108.8973, 34.2122],
    ],
  },
]);
const toolData = ref<any>([
  {
    title: "基础",
    key: 0,
    data: [
      { title: "测量距离" },
      { title: "测量面积" },
      { title: "清除测量" },
    ],
  },
  {
    title: "消防",
    key: 1,
    data: [
      { title: "画笔" },
      { title: "隔离带" },
      { title: "线选" },
      { title: "框选" },
      { title: "多边形选" },
      { title: "圈选" },
      { title: "清除" },
    ],
  },
]);
const toolsindex = ref<string>("");
//地图跳转
function moveXiAn(coordinate: any) {
  (mapRef.value as any).moveToPoint(...coordinate);
}
//显示轨迹
function trajectory() {
  let gis = [
    [108.9423, 34.261],
    [108.9424, 34.2568],
    [108.9478, 34.2566],
    [108.9538, 34.2496],
  ];
  (mapRef.value as any).showWay({
    id: 11, //id
    gis: gis,
    name: "轨迹", //
  });
}
function clearTrajectory() {
  (mapRef.value as any).clearRoute(11);
}
//地图上显示图标
function showIcon() {
  data.value.forEach((item: any) => {
    nextTick(() => {
      (mapRef.value as any).lastShowPoints(
        data.value,
        "icon.png",
        1,
        (item: any) => {
          return {
            show: [
              `${item.name}`,
              `纬度:${item.latitude},经度:${item.longitude}`,
            ],
            data: item,
            popupClass: "popup-box-right",
            bottom: "-13vh",
            left: "15px",
            button: true, //地图弹窗是否显示按钮
            buttonText: "点击", //地图弹窗按钮文字
            circle: true, //是否展示范围
          };
        }
      );
    });
  });
}

//地图上显示范围
function range() {
  nextTick(() => {
    (mapRef.value as any).groupPlot(data.value);
  });
}
//点击工具
function clickTool(n:any,i:number,l:number){
  if(toolsindex.value=='') toolsindex.value=`${i}${l}`; else {
    toolsindex.value='';
    nextTick(()=>{
      (mapRef.value as any).exportMap.removeInteraction((mapRef.value as any).draw);
      (mapRef.value as any).draw = null;
    });
  }
  switch (`${i}${l}`) {
    case '00': //测量距离
    if(toolsindex.value==`00`) (mapRef.value as any).measure("LineString");
      break;
    case '01': //测量面积
    if(toolsindex.value==`01`) (mapRef.value as any).measure("Polygon");
      break;
    case '02': //清除测量
    if(toolsindex.value==`02`) {
      for (const key in (mapRef.value as any).state.drawCache) {
        (mapRef.value as any).exportMap.removeOverlay(
          (mapRef.value as any).state.drawCache[key].measureTooltip
        );
      }
      (mapRef.value as any).exportDrawVector.getSource().clear();
      toolsindex.value =''
    }
      break;
    case "01": //测量距离
      if (toolsindex.value == `01`) (mapRef.value as any).measure("LineString");
      break;
    case "02": //测量面积
      if (toolsindex.value == `02`) (mapRef.value as any).measure("Polygon");
      break;
    case "03": //清除测量
      if (toolsindex.value == `03`) {
        for (const key in (mapRef.value as any).drawCache) {
          (mapRef.value as any).map.removeOverlay(
            (mapRef.value as any).drawCache[key].measureTooltip
          );
        }
        (mapRef.value as any).drawVector.getSource().clear();
        toolsindex.value = "";
      }
      break;
    case "10": //点
      if (toolsindex.value == `10`) (mapRef.value as any).drawLine(true);
      break;
    case "11": //正三角 隔离带
      if (toolsindex.value == `11`) (mapRef.value as any).drawCircle("triangle");
      break;
    case "12": //线
      if (toolsindex.value == `12`) (mapRef.value as any).drawLine(false);
      break;
    case "13": //正方形
      if (toolsindex.value == `13`) (mapRef.value as any).drawCircle("square");
      break;
    case "14": //多边形
      if (toolsindex.value == `14`) (mapRef.value as any).drawPolygon();
      break;
    case "15": //圆形
      if (toolsindex.value == `15`) (mapRef.value as any).drawCircle("circle");
      break;
    case '16': //清除
    if(toolsindex.value==`16`){
      (mapRef.value as any).exportDrawVector.getSource().clear();
      toolsindex.value =''
    } break;
    default:
      break;
  }
  (mapRef.value as any).draw && (mapRef.value as any).draw.on("drawend", () => {
      (mapRef.value as any).exportMap.removeInteraction((mapRef.value as any).draw);
      (mapRef.value as any).draw = null;
      toolsindex.value = '';
    });
}

</script>
<style lang="scss" scoped>
.Box {
  width: 100%;
  height: 100vh;
  position: relative;
  .homeBox {
    width: 100%;
    height: 100%;
    border: 1px solid gray;
    display: flex;
    justify-content: space-between;
    align-items: flex-start;
    .leftBox {
      width: 20%;
    }
    .map-wrap {
      flex: 1;
      height: 100%;
      position: relative;
    }
  }
}

//地图弹窗样式
.map_right {
  color: #fff;
  font-size: 14px;
  padding: 15px 20px;
  display: flex;
  flex-direction: column;
  span:nth-child(n) {
    display: flex;
    flex-direction: column;
    margin-bottom: 10px;
    white-space: nowrap;
  }
  span:nth-child(1) {
    font-size: 16px;
    font-weight: 500;
    margin-top: 10px;
  }
  > button {
    // color: #409EFF;
    background: #409eff;
    text-align: center !important;
    padding: 6px 0;
    border: none;
    margin: 10px 16px 20px 16px;
    cursor: pointer;
  }
}
.work-box {
  display: flex;
  align-items: center;
  color: #fff;
  position: absolute;
  bottom: 60px;
  left: 30px;
  .tool {
    position: absolute;
    // bottom: 100%;
    display: flex;
    flex-direction: column;
    justify-content: center;
    border: 1px solid;
    margin: 0 20px;
    background: gray;
    border-radius: 5px;
    > * {
      padding: 0 10px;
      display: flex;
      width: 510px;
      align-items: center;
      > span {
        font-size: 16px;
        font-weight: 700;
      }
      > div:first-child {
        border-bottom: 1px solid;
      }
      > div {
        margin: 3px 10px;
        display: flex;
        flex: 1;
        justify-content: space-around;
        span {
          display: inline-block;
          padding: 8px;
          border: 1px solid;
          cursor: pointer;
          margin: 3px 5px;
          font-size: 14px;
          border-radius: 5px;
        }
      }
    }
  }
}
</style>
原文地址:https://blog.csdn.net/qq_43923146/article/details/127118074
本文来自互联网用户投稿,该文观点仅代表作者本人,不代表本站立场。本站仅提供信息存储空间服务,不拥有所有权,不承担相关法律责任。
如若转载,请注明出处:http://www.7code.cn/show_36722.html
如若内容造成侵权/违法违规/事实不符,请联系代码007邮箱:suwngjj01@126.com进行投诉反馈,一经查实,立即删除!
主题授权提示:请在后台主题设置-主题授权-激活主题的正版授权,授权购买:RiTheme官网
声明:本站所有文章,如无特殊说明或标注,均为本站原创发布。任何个人或组织,在未征得本站同意时,禁止复制、盗用、采集、发布本站内容到任何网站、书籍等各类媒体平台。如若本站内容侵犯了原著者的合法权益,可联系我们进行处理。

