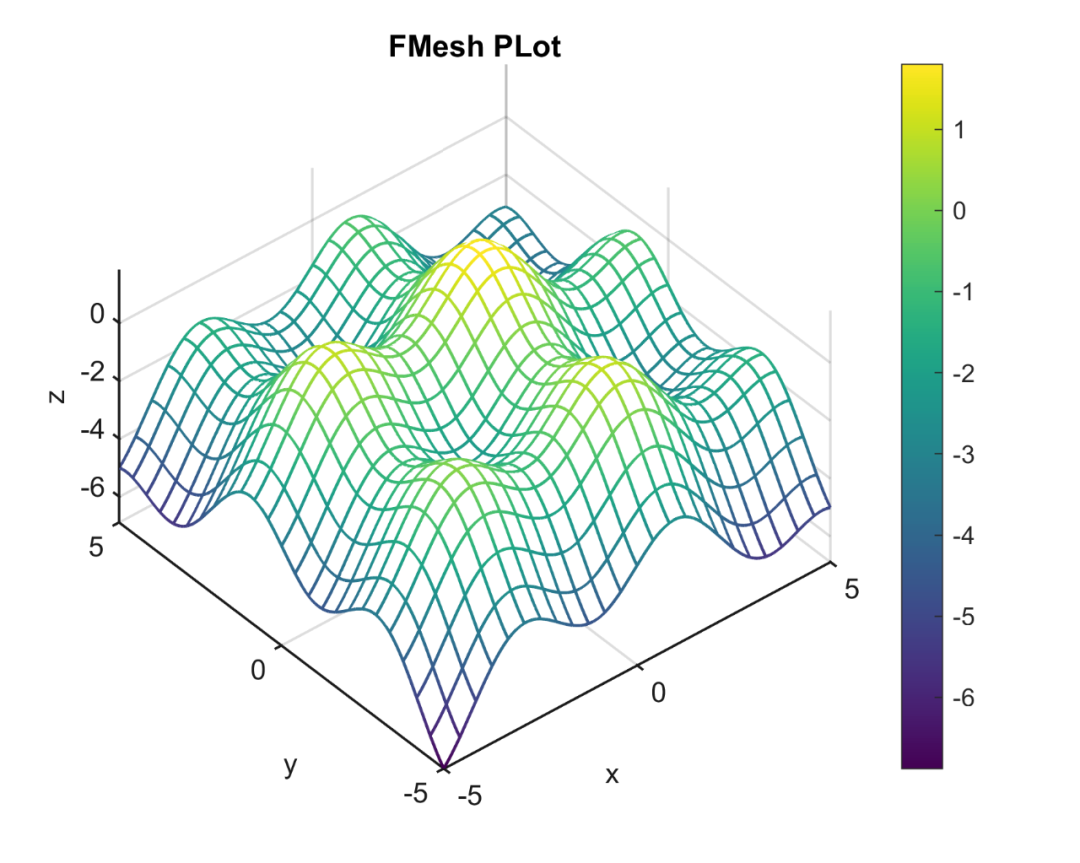

先来看一下成品效果:

特别提示:本期内容『数据+代码』已上传资源群中,加群的朋友请自行下载。有需要的朋友可以关注同名公号【阿昆的科研日常】,后台回复关键词【绘图桶】查看加入方式。
% 构造函数fun = @(x,y) sin(1.5*x)+sin(1.5*y)-(x.^2+y.^2)/10;
%% 颜色定义map = TheColor('sci',2068);% map = flipud(map);

fmesh(fun,'LineWidth',1.2,'MeshDensity',25)hTitle = title('FMesh PLot');hXLabel = xlabel('x');hYLabel = ylabel('y');hZLabel = zlabel('z');view(-40,52)
% 赋色colormap(map)colorbar% 坐标区调整set(gca, 'Box', 'off', ... % 边框'LineWidth', 1, 'GridLineStyle', '-',... % 坐标轴线宽'XGrid', 'on', 'YGrid', 'on','ZGrid', 'on', ... % 网格'TickDir', 'out', 'TickLength', [.015 .015], ... % 刻度'XMinorTick', 'off', 'YMinorTick', 'off', 'ZMinorTick', 'off',... % 小刻度'XColor', [.1 .1 .1], 'YColor', [.1 .1 .1], 'ZColor', [.1 .1 .1]) % 坐标轴颜色% 字体和字号set(gca, 'FontName', 'Arial', 'FontSize', 11)set([hXLabel,hYLabel,hZLabel], 'FontName', 'Arial', 'FontSize', 11)set(hTitle, 'FontSize', 12, 'FontWeight' , 'bold')% 背景颜色set(gcf,'Color',[1 1 1])
%% 图片输出figW = figureWidth;figH = figureHeight;set(figureHandle,'PaperUnits',figureUnits);set(figureHandle,'PaperPosition',[0 0 figW figH]);fileout = 'test';print(figureHandle,[fileout,'.png'],'-r300','-dpng');

以上。
原文地址:https://blog.csdn.net/qq_26447137/article/details/134774702
本文来自互联网用户投稿,该文观点仅代表作者本人,不代表本站立场。本站仅提供信息存储空间服务,不拥有所有权,不承担相关法律责任。
如若转载,请注明出处:http://www.7code.cn/show_38522.html
如若内容造成侵权/违法违规/事实不符,请联系代码007邮箱:suwngjj01@126.com进行投诉反馈,一经查实,立即删除!