npm install echarts echarts-gl --save 地图数据可从阿里的datav平台下载json格式的地图数据 传送门

import * as echarts from "echarts";
import "echarts-gl"; const mapData = require("./assets/changsha.json");initEcharts() {
echarts.registerMap(mapName, mapData);
const myChart = echarts.init(
document.getElementById("mainMap") as HTMLElement
);
myChart.setOption({
geo3D: {
show: true,
map: mapName,
shading: "realistic",
boxDepth: 60, //地图倾斜度
regionHeight: 3, //地图高度
itemStyle: {
color: "#4575b4", //地图颜色
borderWidth: 1.5, //分界线宽度
borderColor: "#459bca", //分界线颜色
},
realisticMaterial: {
// detailTexture: 'imgs/19.jpeg',
textureTiling: 1,
roughness: 1,
metalness: 0,
roughnessAdjust: 0,
},
environment: new echarts.graphic.LinearGradient(
0,
0,
0,
1,
[
{
offset: 0,
color: "#09C7F7", // 天空颜色
},
{
offset: 0.7,
color: "#fff", // 地面颜色
},
{
offset: 1,
color: "#A2875E", // 地面颜色
},
],
false
),
emphasis: {
label: {
show: true, //是否显示标签
textStyle: {
color: "#fff", //高亮文字颜色
fontFamily: "微软雅黑",
},
},
},
},
});
//点击显示点击的地区
myChart.on("click", function (params) {
alert(params.name);
});
}```JavaScript
import React, { Component } from "react";
import * as echarts from "echarts";
import "echarts-gl";
const mapData = require("./assets/changsha.json");
const mapName = "changsha";
class Map extends Component {
componentDidMount() {
this.initEcharts();
}
initEcharts() {
    echarts.registerMap(mapName, mapData);
    const myChart = echarts.init(
      document.getElementById("mainMap") as HTMLElement
    );

    myChart.setOption({
      geo3D: {
        show: true,
        map: mapName,
        shading: "realistic",
        boxDepth: 60, //地图倾斜度
        regionHeight: 3, //地图高度
        itemStyle: {
          color: "#4575b4", //地图颜色
          borderWidth: 1.5, //分界线宽度
          borderColor: "#459bca", //分界线颜色
        },
        realisticMaterial: {
          // detailTexture: 'imgs/19.jpeg',
          textureTiling: 1,
          roughness: 1,
          metalness: 0,
          roughnessAdjust: 0,
        },
        environment: new echarts.graphic.LinearGradient(
          0,
          0,
          0,
          1,
          [
            {
              offset: 0,
              color: "#09C7F7", // 天空颜色
            },
            {
              offset: 0.7,
              color: "#fff", // 地面颜色
            },
            {
              offset: 1,
              color: "#A2875E", // 地面颜色
            },
          ],
          false
        ),
        emphasis: {
          label: {
            show: true, //是否显示标签
            textStyle: {
              color: "#fff", //高亮文字颜色
              fontFamily: "微软雅黑",
            },
          },
        },
      },
    });

    //点击显示点击的地区
    myChart.on("click", function (params) {
      alert(params.name);
    });
  }
render(): React.ReactNode {
return <div id="mainMap" style={{ width: "100vm", height: "90vh" }}></div>;
}
}
export default Map;
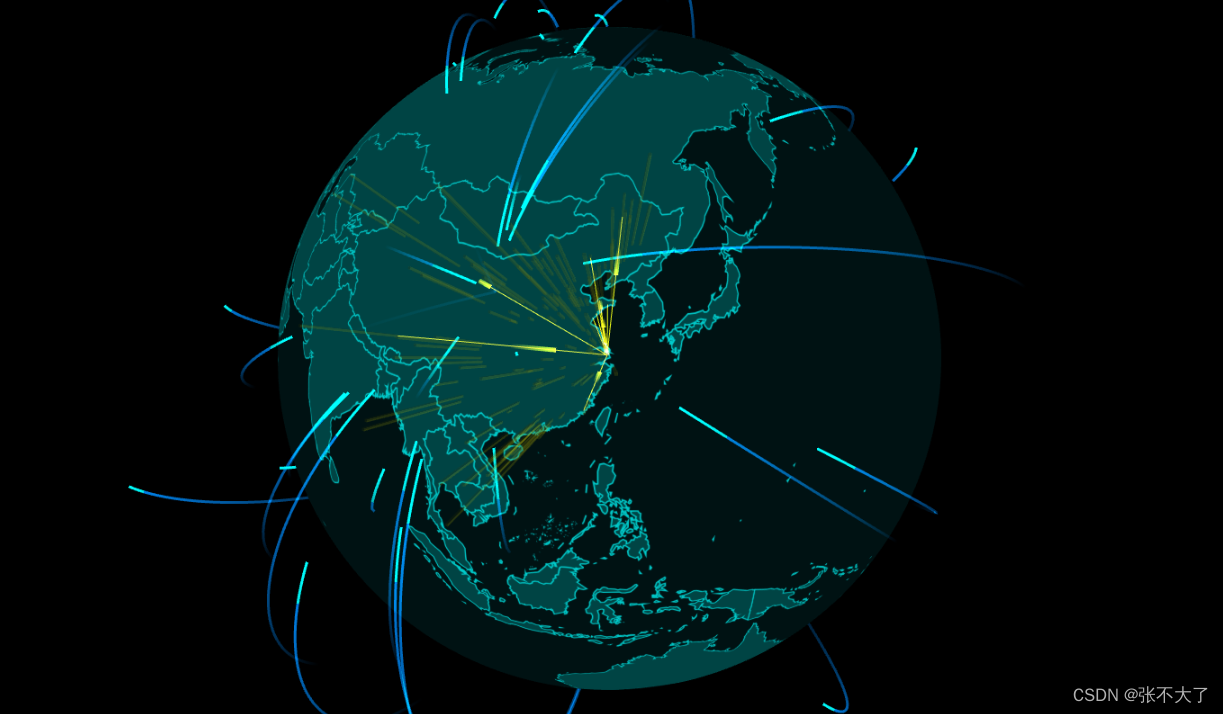
```7、最终效果图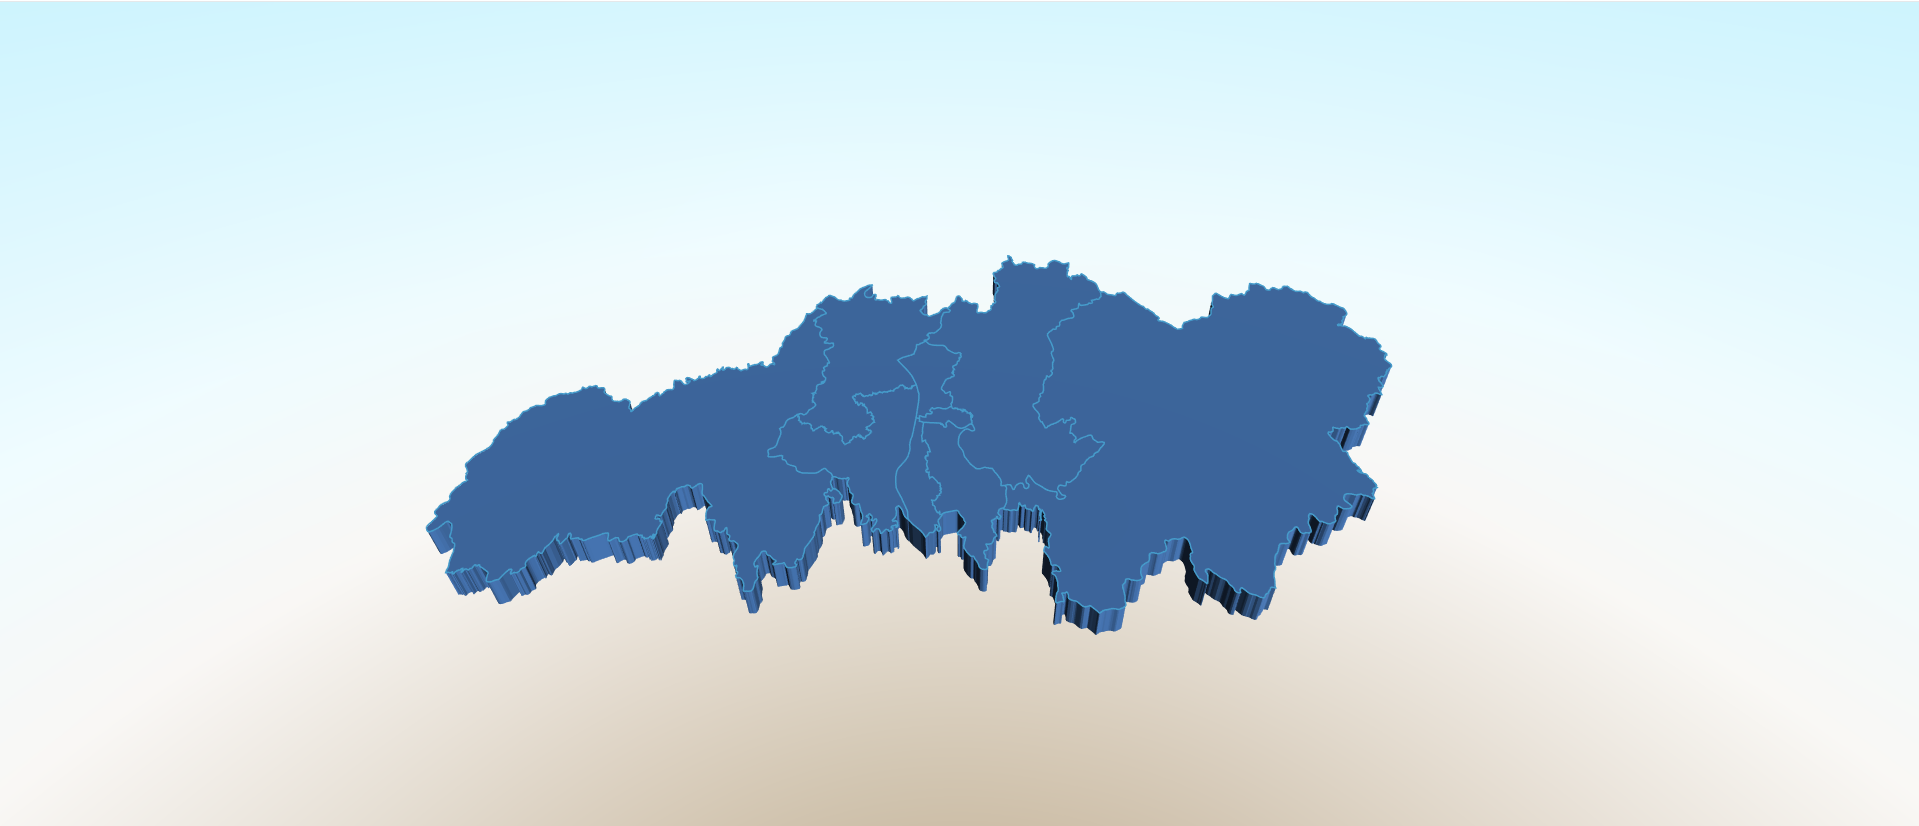
Documentation – Apache ECharts
vue echarts 离线datav地图使用_三火Sunfire的博客-CSDN博客_echarts离线地图
原文地址:https://blog.csdn.net/chensheng8085497/article/details/124989093
本文来自互联网用户投稿,该文观点仅代表作者本人,不代表本站立场。本站仅提供信息存储空间服务,不拥有所有权,不承担相关法律责任。
如若转载,请注明出处:http://www.7code.cn/show_38778.html
如若内容造成侵权/违法违规/事实不符,请联系代码007邮箱:suwngjj01@126.com进行投诉反馈,一经查实,立即删除!
主题授权提示:请在后台主题设置-主题授权-激活主题的正版授权,授权购买:RiTheme官网
声明:本站所有文章,如无特殊说明或标注,均为本站原创发布。任何个人或组织,在未征得本站同意时,禁止复制、盗用、采集、发布本站内容到任何网站、书籍等各类媒体平台。如若本站内容侵犯了原著者的合法权益,可联系我们进行处理。


