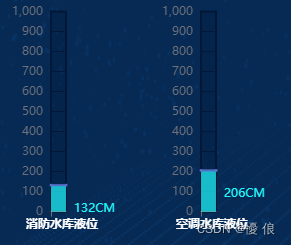
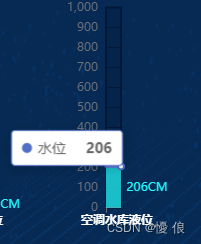
网上找了一下液位仪感觉不符合项目的样式需求,于是自己封装了一个
<template>
<div ref="element" class="w100 h100-level charts-wrapper"></div>
</template>
<script setup lang="ts">
import * as echarts from 'echarts';
import 'echarts-liquidfill';
import { defineProps, onMounted, ref, watch } from 'vue';
const props = defineProps({
value: {
type: Object,
required: true
},
data: {
type: String,
required: true
}
});
const element = ref();
const option = ref({
title: {
text: props.value.label,
textStyle: {
color: '#ffffff',
align: 'center',
fontSize: 12,
weight: 100
},
left: '20%',
bottom: '0%'
},
grid: {
// 控制图的大小,调整下面这些值就可以,
x: 1,
y: 4,
x2: 60,
y2: 1, // y2可以控制 X轴跟Zoom控件之间的间隔,避免以为倾斜后造成 label重叠到zoom上
// backgroundColor: '#cdcdcd',
show: true,
left: '50%',
right: '60%',
top: '8%',
bottom: '10%',
borderWidth: 2, // 图标外边框大小
borderColor: '#011737' // 图标边框颜色
},
tooltip: {
trigger: 'item'
},
xAxis: [
{
type: 'category',
axisLabel: {
show: false
},
boundaryGap: false,
data: ['水位', '水位']
}
],
yAxis: [
{
// name:"aaa",
type: 'value',
// axisLabel: { show: false },
min: 0,
max: 1000,
splitNumber: 10,
show: true,
splitLine: {
// 坐标轴内分割线
show: true,
lineStyle: {
color: '#031738'
}
}, // 坐标轴内背景
splitArea: {
show: true,
areaStyle: {
color: ['rgba(2, 23, 56,0.3)', 'rgba(2, 23, 56,0.3)'] // 分隔背景用两种颜色显示
}
}
}
],
series: [
{
type: 'line',
// 显示标签数据
itemStyle: {
normal: {
areaStyle: {
color: '#21fbff'
},
left: 0
}
},
data: [
{
value: props.value.value.replace('CM', '')
},
{
value: props.value.value.replace('CM', ''),
label: {
show: true,
position: [20, 0],
width: 20,
height: 100,
// formatter: '{back|{c} }'+ params.senUnitName ,
formatter: '{back|{c}CM}',
// formatter: `{back|{c}}{unit| ${props.value.value.replace('CM', '')}CM}`,
rich: {
back: {
align: 'center',
lineHeight: 50,
fontSize: 12,
fontFamily: 'digifacewide',
color: '#21fbff'
},
unit: {
fontFamily: '微软雅黑',
fontSize: 12,
lineHeight: 50,
color: '#21fbff'
}
}
}
}
],
symbolSize: 1
}
]
});
// const updateOptions = (waveNum: number) => {
// option.value.series[0].data = [waveNum, waveNum];
// option.value.series[0].color[0].colorStops[0].color = props.firstColor;
// option.value.series[0].color[0].colorStops[1].color = props.lastColor;
// return option.value;
// };
onMounted(() => {
const chartDom = element.value;
const myChart = echarts.init(chartDom);
// 更新图表
const updateChart = (): void => {
myChart.setOption(option.value);
};
// updateOptions(waveNumber());
updateChart();
watch(
() => props.value,
() => {
// updateOptions(waveNumber());
updateChart();
}
);
});
</script>
<style lang="scss" scoped>
.h100-level {
height: calc(100% - 21px);
}
</style>
原文地址:https://blog.csdn.net/dick_1999/article/details/126009791
本文来自互联网用户投稿,该文观点仅代表作者本人,不代表本站立场。本站仅提供信息存储空间服务,不拥有所有权,不承担相关法律责任。
如若转载,请注明出处:http://www.7code.cn/show_41244.html
如若内容造成侵权/违法违规/事实不符,请联系代码007邮箱:suwngjj01@126.com进行投诉反馈,一经查实,立即删除!
主题授权提示:请在后台主题设置-主题授权-激活主题的正版授权,授权购买:RiTheme官网
声明:本站所有文章,如无特殊说明或标注,均为本站原创发布。任何个人或组织,在未征得本站同意时,禁止复制、盗用、采集、发布本站内容到任何网站、书籍等各类媒体平台。如若本站内容侵犯了原著者的合法权益,可联系我们进行处理。