什么是引导线?
引导线就是label(文本标签)链接的线
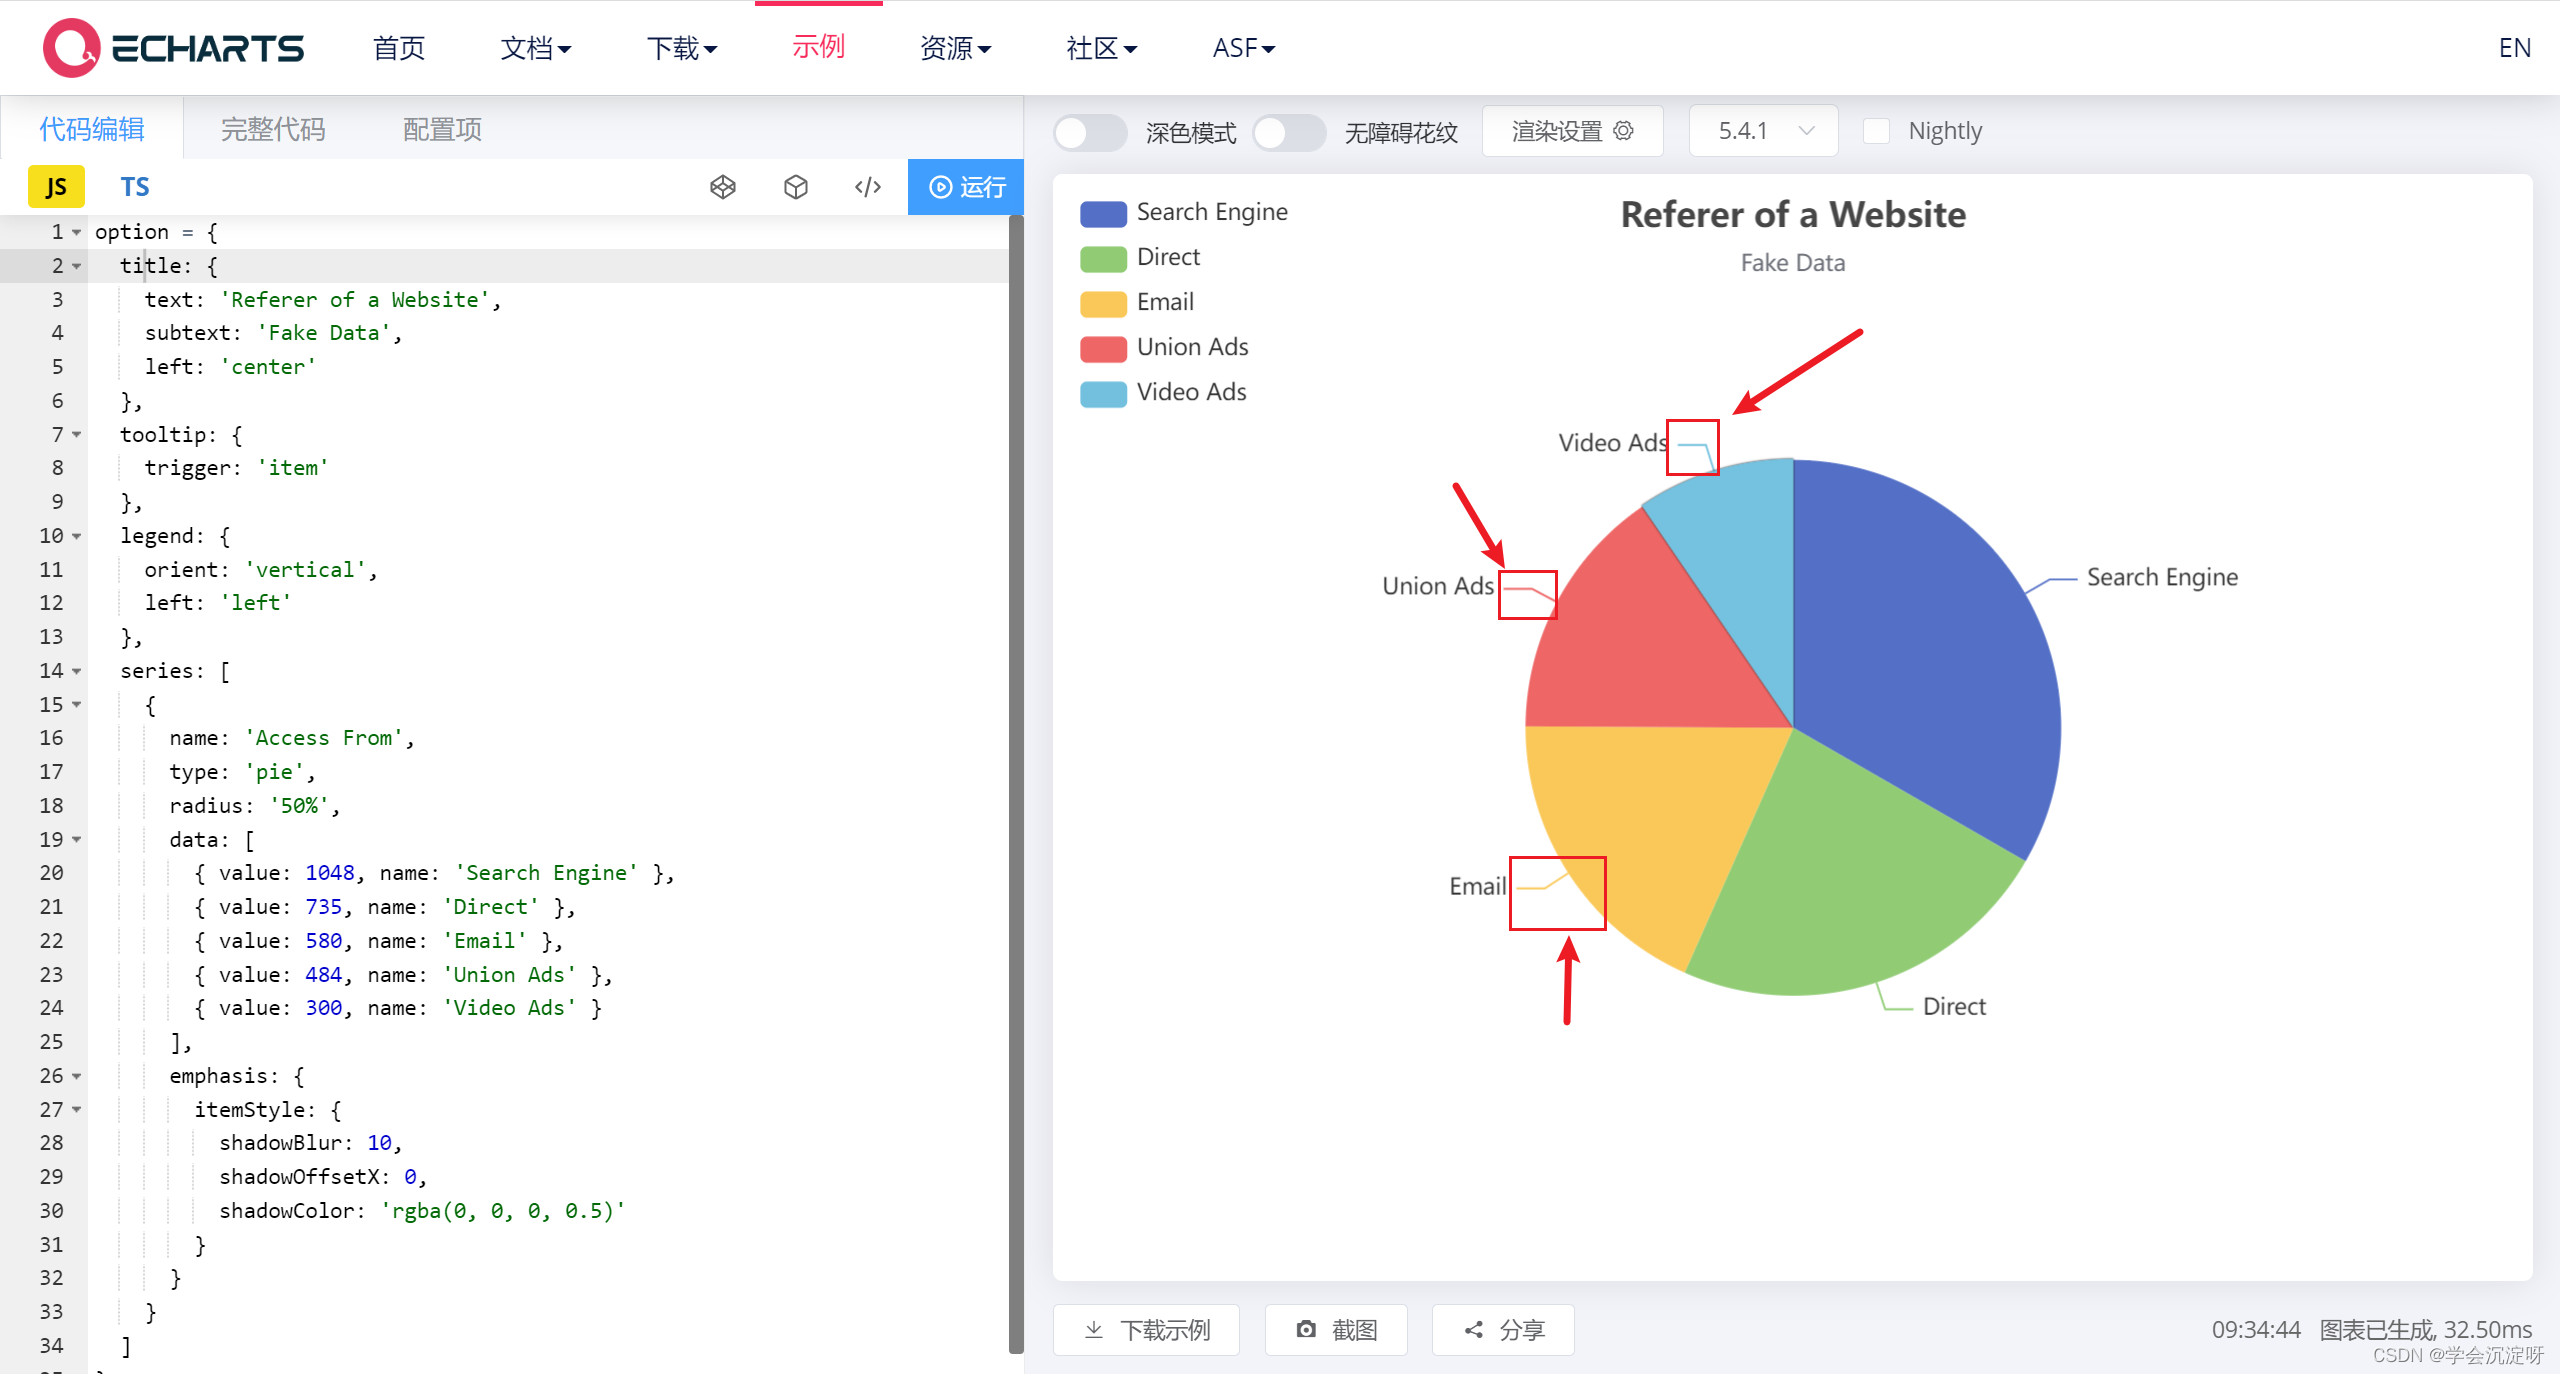
引导线分两段
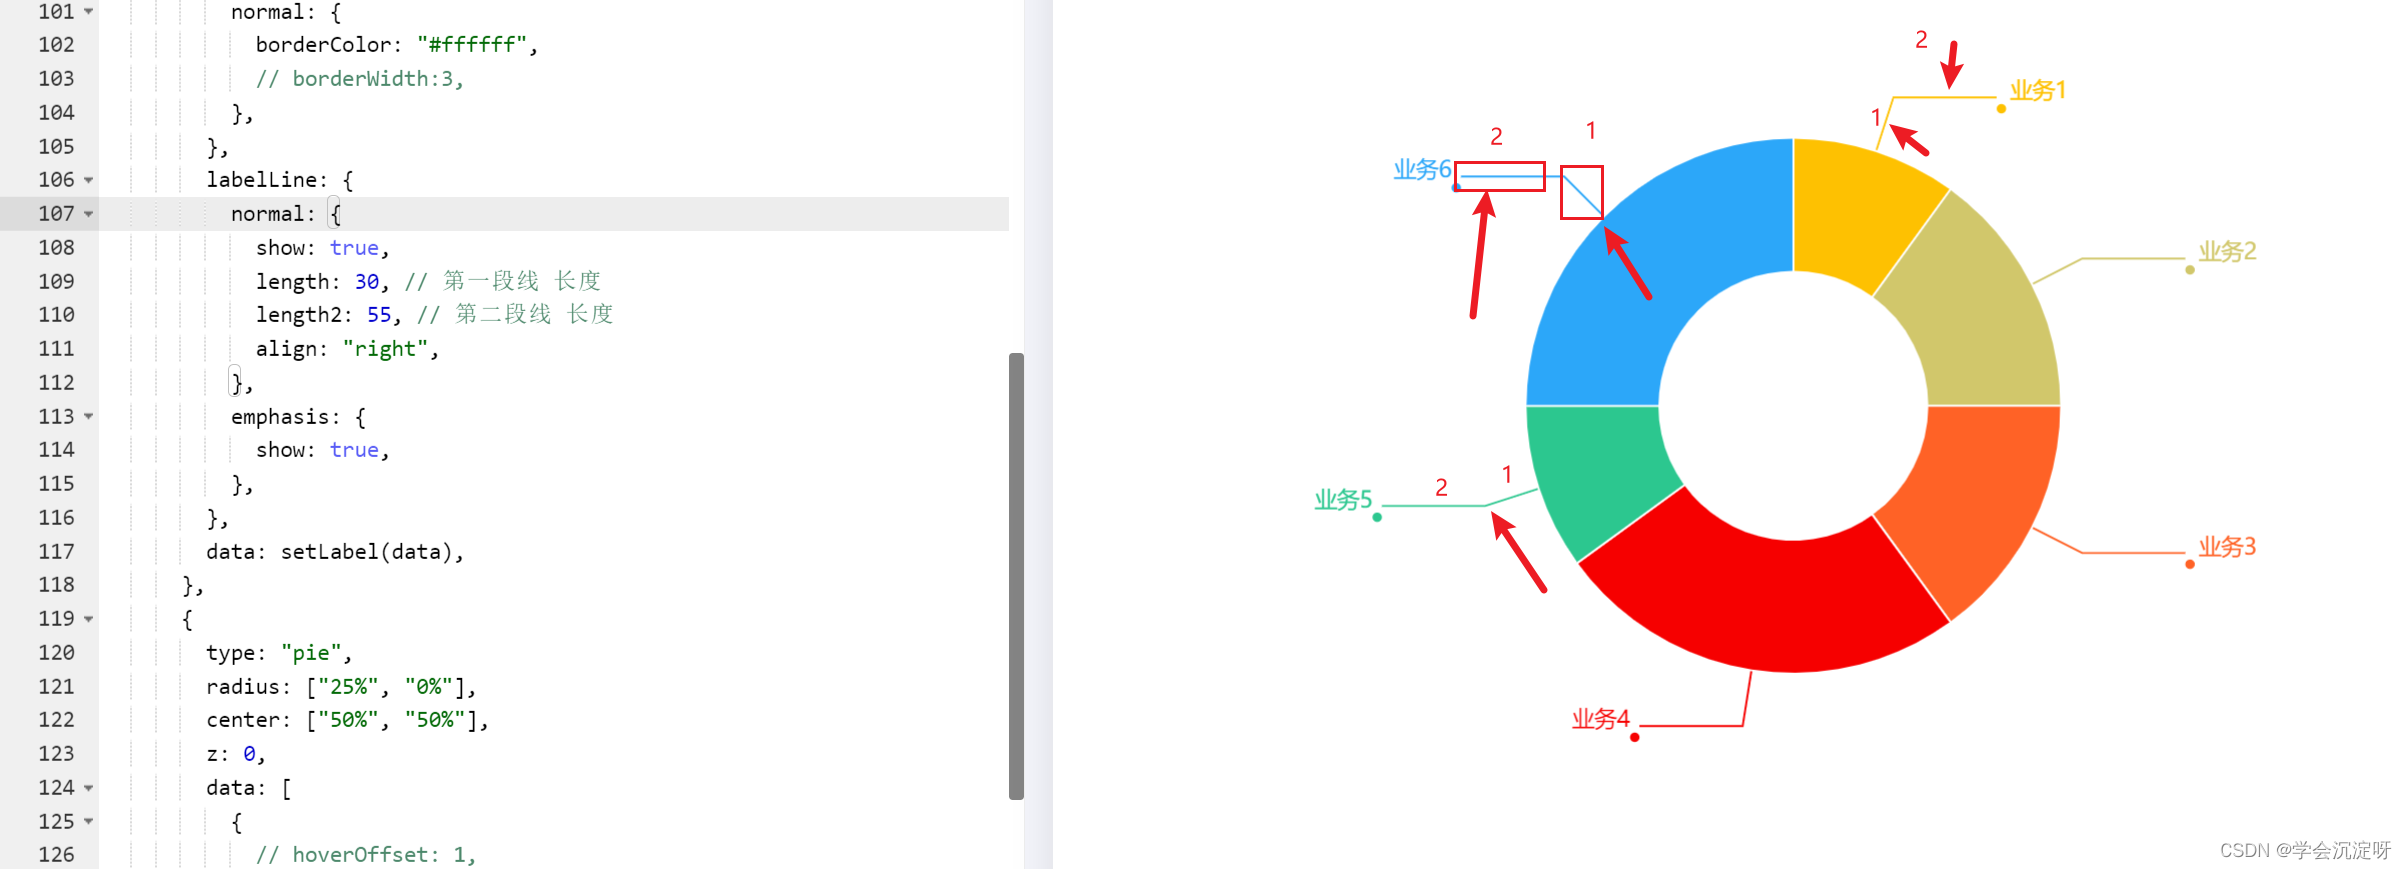
从拐弯的地方开始分,接近圆的是length(引导线1),接近label的是length2(引导线2)
需求一:要求水平引导线
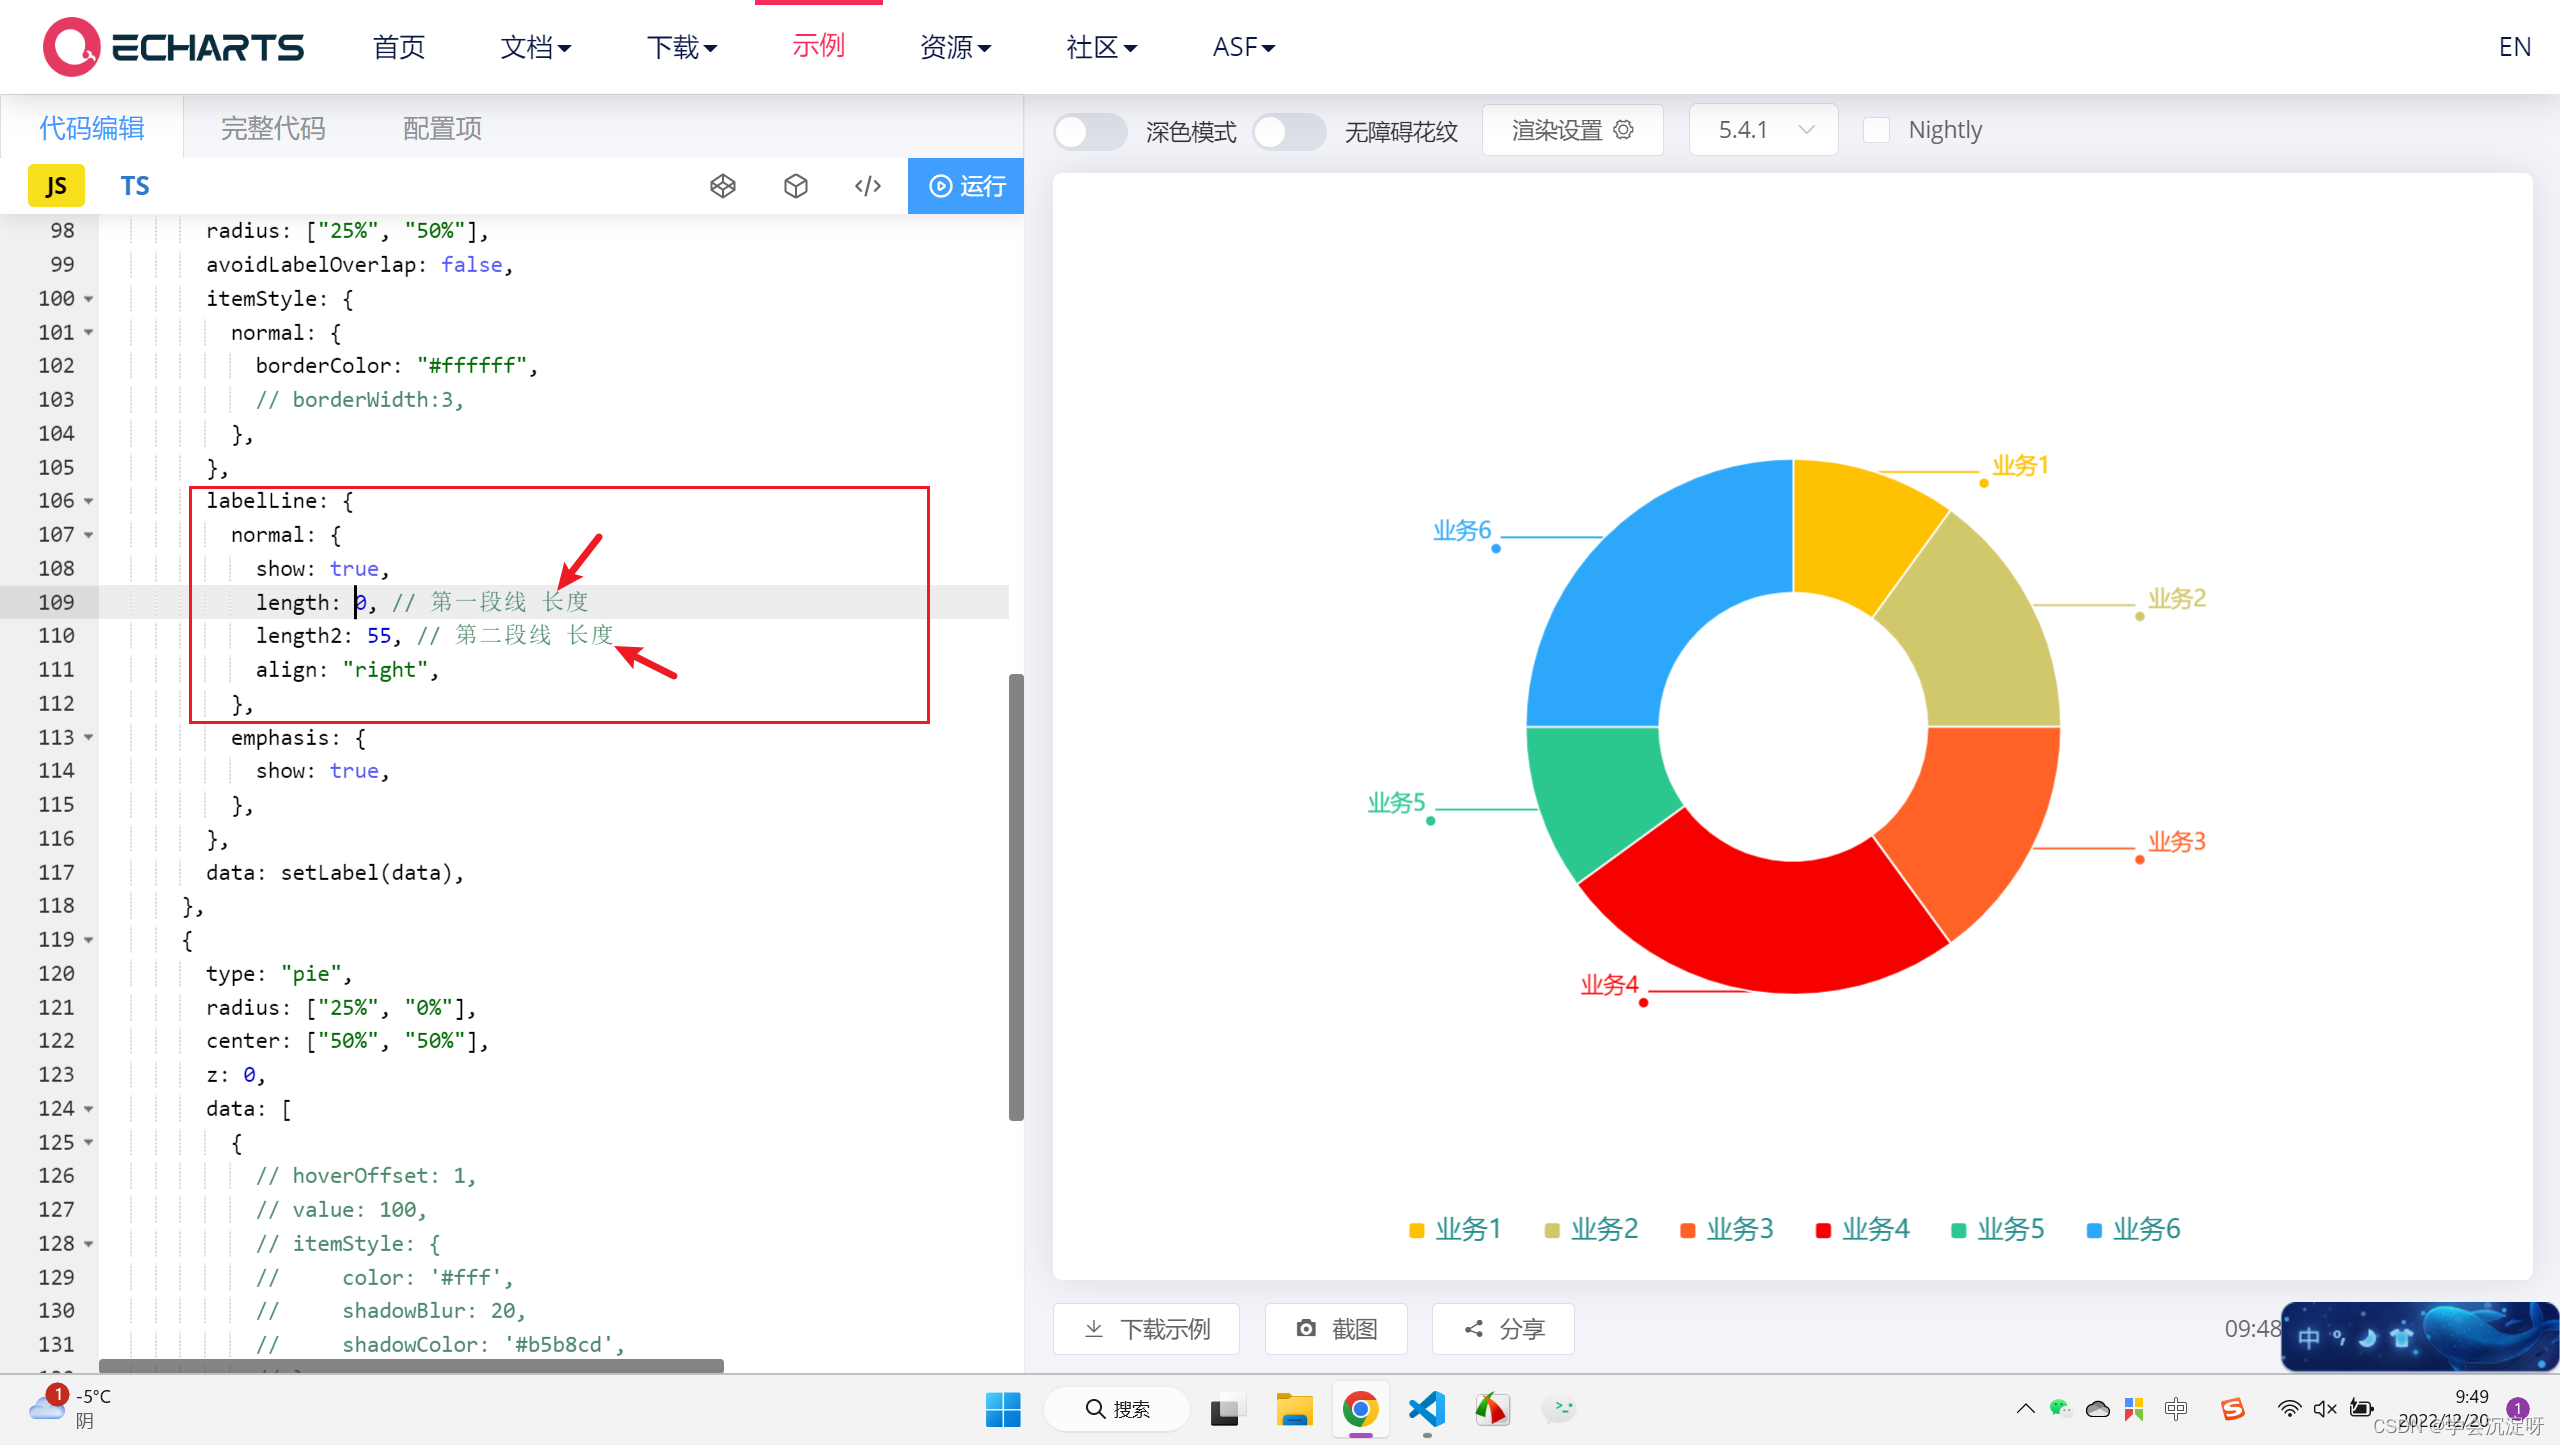
让第一段引导线长度为0,第二段自己调试长度
 let data = [
    { name: "业务1", value: 10 },
    { name: "业务2", value: 15 },
    { name: "业务3", value: 15 },
    { name: "业务4", value: 25 },
    { name: "业务5", value: 10 },
    { name: "业务6", value: 25 },
  ];
  let color = ["#fec101", "#D1C76B ", "#ff6226", "#f60000", "#2cc78f", "#2ca7f9"];
  // 这步主要是为了让小圆点的颜色和饼状图的块对应,如果圆点的颜色是统一的,只需要把itemStyle写在series里面
  let setLabel = (data) => {
    let opts = [];
    for (let i = 0; i < data.length; i++) {
      let item = {};
      item.name = data[i].name;
      item.value = data[i].value;
      item.label = {
        normal: {
          //控制引导线上文字颜色和位置,此处a是显示文字区域,b做一个小圆圈在引导线尾部显示
          show: true,
          //a和b来识别不同的文字区域
          formatter: [
            "{a|{b}}", //引导线上面文字
            "{b|}", //引导线下面文字
            // '{c|{c}}', //引导线下面文字
            // "{d}",
          ].join("n"), //用n来换行
          // formatter:'{d}',
          rich: {
            a: {
              left: 10,
              // padding: [0, -50, 20, -50],
              padding: [0, 0, 0, 2],
              color: color[i],
            },
            b: {
              height: 5,
              width: 5,
              lineHeight: 5,
              marginBottom: 0,
              padding: [0, -5],
              borderRadius: 5,
              backgroundColor: color[i], // 圆点颜色和饼图块状颜色一致
            },
            c: {
              left: 20,
              padding: [20, -35, 0, -35],
              color: color[i],
            },
            d: {
              // left:35,
              // top:20,
              // padding:[10,0,10,10],
              // color: color[i]
            },
          },
        },
      };

      opts.push(item);
    }
    return opts;
  };
   option = {
    legend: {
      left: "center",
      itemHeight: 10,
      itemWidth: 10,
      textStyle: {
        fontSize: 14, //字体大小
        color: "#268C8C", //字体颜色
      },
      itemGap: 20,
      bottom: "5px",
    },
    grid: {
      show: false,
      left: "10%",
      // bottom: "10%",
    },
    // backgroundColor: "#d9d9d9",
    // title:{
    //     text: 'eeeeneeee',
    //     x: 'center',
    //     top: 'center',
    //     textStyle: {
    //         color: '#222',
    //         fontSize: 22,
    //         fontWeight: '600',
    //     }
    // },
    animation: true,
    series: [
      {
        color: color,
        name: "饼图圆点",
        type: "pie",
        radius: ["25%", "50%"],
        avoidLabelOverlap: false,
        itemStyle: {
          normal: {
            borderColor: "#ffffff",
            // borderWidth:3,
          },
        },
        labelLine: {
          normal: {
            show: true,
            length: 0, // 第一段线 长度
            length2: 55, // 第二段线 长度
            align: "right",
          },
          emphasis: {
            show: true,
          },
        },
        data: setLabel(data),
      },
      {
        type: "pie",
        radius: ["25%", "0%"],
        center: ["50%", "50%"],
        z: 0,
        data: [
          {
            // hoverOffset: 1,
            // value: 100,
            // itemStyle: {
            //     color: '#fff',
            //     shadowBlur: 20,
            //     shadowColor: '#b5b8cd',
            // },
            // label: {
            //     show: false
            // },
            // labelLine: {
            //     normal: {
            //         smooth: true,
            //         lineStyle: {
            //             width: 0
            //         }
            //     }
            // },
            // hoverAnimation: false,
          },
        ],
      },
    ],
  };
这里是代码
需求二:要求水平引导线末端加上圆点
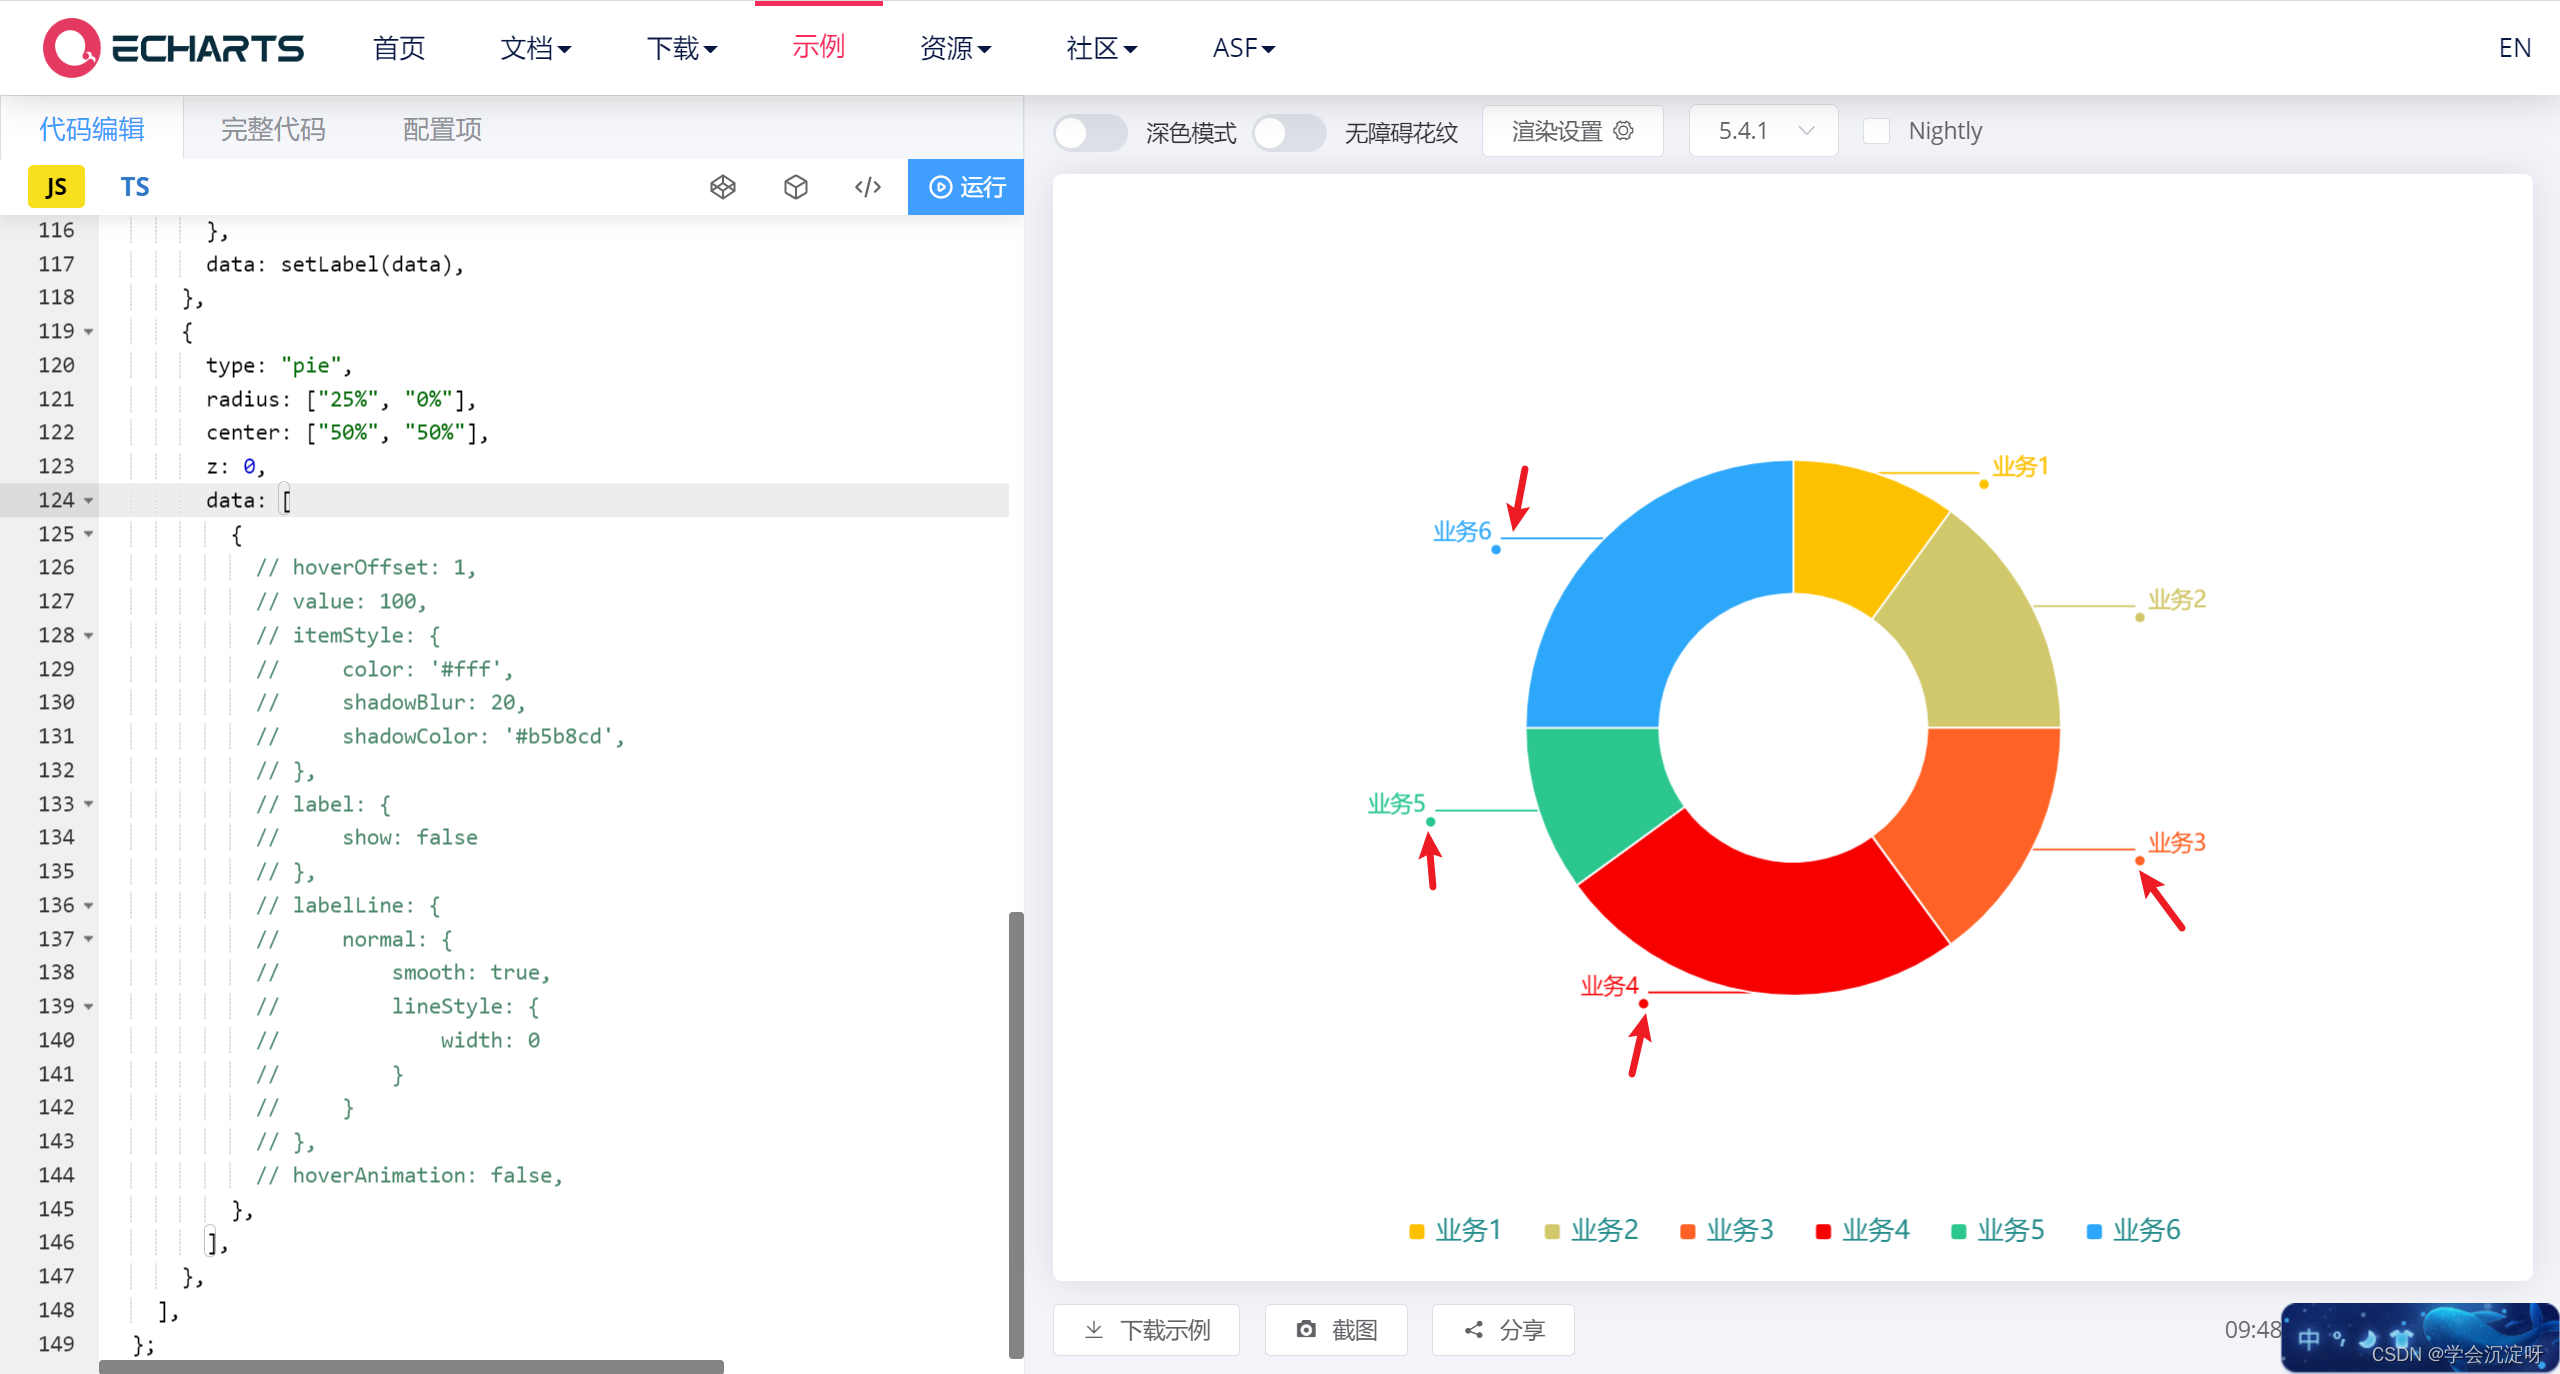
可以参考上面代码的位置,把它放在echarts的实例编辑器上自己调试
 let data = [
    { name: "业务1", value: 10 },
    { name: "业务2", value: 15 },
    { name: "业务3", value: 15 },
    { name: "业务4", value: 25 },
    { name: "业务5", value: 10 },
    { name: "业务6", value: 25 },
  ];
  let color = ["#fec101", "#D1C76B ", "#ff6226", "#f60000", "#2cc78f", "#2ca7f9"];
  // 这步主要是为了让小圆点的颜色和饼状图的块对应,如果圆点的颜色是统一的,只需要把itemStyle写在series里面
  let setLabel = (data) => {
    let opts = [];
    for (let i = 0; i < data.length; i++) {
      let item = {};
      item.name = data[i].name;
      item.value = data[i].value;
      item.label = {
        normal: {
          //控制引导线上文字颜色和位置,此处a是显示文字区域,b做一个小圆圈在引导线尾部显示
          show: true,
          //a和b来识别不同的文字区域
          formatter: [
            "{a|{b}}", //引导线上面文字
            "{b|}", //引导线下面文字
            // '{c|{c}}', //引导线下面文字
            // "{d}",
          ].join("n"), //用n来换行
          // formatter:'{d}',
          rich: {
            a: {
              left: 10,
              // padding: [0, -50, 20, -50],
              padding: [0, 0, 0, 2],
              color: color[i],
            },
            b: {
              height: 5,
              width: 5,
              lineHeight: 5,
              marginBottom: 0,
              padding: [0, -5],
              borderRadius: 5,
              backgroundColor: color[i], // 圆点颜色和饼图块状颜色一致
            },
            c: {
              left: 20,
              padding: [20, -35, 0, -35],
              color: color[i],
            },
            d: {
              // left:35,
              // top:20,
              // padding:[10,0,10,10],
              // color: color[i]
            },
          },
        },
      };

      opts.push(item);
    }
    return opts;
  };
   option = {
    legend: {
      left: "center",
      itemHeight: 10,
      itemWidth: 10,
      textStyle: {
        fontSize: 14, //字体大小
        color: "#268C8C", //字体颜色
      },
      itemGap: 20,
      bottom: "5px",
    },
    grid: {
      show: false,
      left: "10%",
      // bottom: "10%",
    },
    // backgroundColor: "#d9d9d9",
    // title:{
    //     text: 'eeeeneeee',
    //     x: 'center',
    //     top: 'center',
    //     textStyle: {
    //         color: '#222',
    //         fontSize: 22,
    //         fontWeight: '600',
    //     }
    // },
    animation: true,
    series: [
      {
        color: color,
        name: "饼图圆点",
        type: "pie",
        radius: ["25%", "50%"],
        avoidLabelOverlap: false,
        itemStyle: {
          normal: {
            borderColor: "#ffffff",
            // borderWidth:3,
          },
        },
        labelLine: {
          normal: {
            show: true,
            length: 0, // 第一段线 长度
            length2: 55, // 第二段线 长度
            align: "right",
          },
          emphasis: {
            show: true,
          },
        },
        data: setLabel(data),
      },
      {
        type: "pie",
        radius: ["25%", "0%"],
        center: ["50%", "50%"],
        z: 0,
        data: [
          {
            // hoverOffset: 1,
            // value: 100,
            // itemStyle: {
            //     color: '#fff',
            //     shadowBlur: 20,
            //     shadowColor: '#b5b8cd',
            // },
            // label: {
            //     show: false
            // },
            // labelLine: {
            //     normal: {
            //         smooth: true,
            //         lineStyle: {
            //             width: 0
            //         }
            //     }
            // },
            // hoverAnimation: false,
          },
        ],
      },
    ],
  };
echarts就是不断调试慢慢就调出来了
原文地址:https://blog.csdn.net/weixin_45372418/article/details/128380548
本文来自互联网用户投稿,该文观点仅代表作者本人,不代表本站立场。本站仅提供信息存储空间服务,不拥有所有权,不承担相关法律责任。
如若转载,请注明出处:http://www.7code.cn/show_41248.html
如若内容造成侵权/违法违规/事实不符,请联系代码007邮箱:suwngjj01@126.com进行投诉反馈,一经查实,立即删除!
声明:本站所有文章,如无特殊说明或标注,均为本站原创发布。任何个人或组织,在未征得本站同意时,禁止复制、盗用、采集、发布本站内容到任何网站、书籍等各类媒体平台。如若本站内容侵犯了原著者的合法权益,可联系我们进行处理。

