上代码
import React from "react";
import * as echarts from "echarts";
import styles from "./index.less";
// var Highcharts = require("highcharts/highmaps.src.js");
import Highcharts from "highcharts";
import highcharts3d from "highcharts/highcharts-3d";
highcharts3d(Highcharts);
class DoughnutChart extends React.Component {
constructor(props) {
super(props);
}
loadDoughnut = () => {
const { totalSize } = this.props.data;
let totalData = totalSize / 1099511627776;
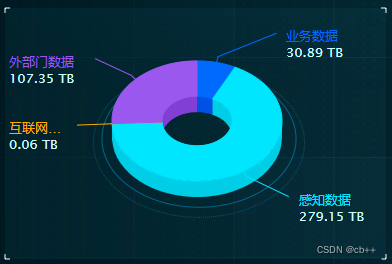
let realData = [
["业务数据", Number((totalData * 0.07399856).toFixed(2))],
["感知数据", Number((totalData * 0.668697529).toFixed(2))],
["互联网数据", Number((totalData * 0.000143919).toFixed(2))],
["外部门数据", Number((totalData * 0.25715999).toFixed(2))],
];
Highcharts.chart("dought", {
chart: {
backgroundColor: "transparent",
type: "pie",
options3d: {
enabled: true,
alpha: 45,
},
},
title: {
text: "",
},
credits: { enabled: false },
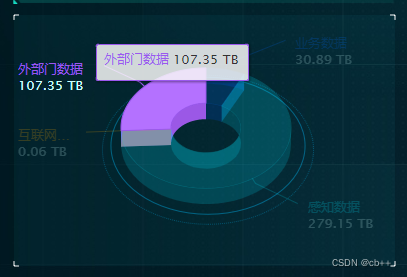
tooltip: {
headerFormat: "",
pointFormat:
'<div style="font-size: 13px"><span style="color:{point.color}; font-weight:400">{point.name}</span><span style="font-weight:400"> {point.y} TB</span></div> ',
},
plotOptions: {
pie: {
size: 170,
innerSize: 70,
depth: 30,
cursor: "pointer",
colors: ["#006AFF", "#00E6FF", "#FFAB00", "#9B58EE", "#00F39F"],
dataLabels: {
softConnector: false,
enabled: true,
format:
'<div ><span style="color:{point.color}; font-weight:400">{point.name}</span><br/><span style="color:#CCFFFE; font-weight:400">{point.y} TB</span></div> ',
style: {
color: "#eee",
fontSize: "13px",
textOutline: "none",
},
},
},
},
series: [
{
name: "接入总量",
data: realData,
},
],
});
};
componentDidMount() {
// 页面加载完毕加载饼图
this.loadDoughnut();
}
render() {
return (
<div
style={{
width: "96%",
height: "100%",
position: "relative",
top: "-10px",
}}
id="dought"
className={styles.dought}
>
{/* <ReactHighcharts config={config} ref="chart" /> */}
</div>
);
}
}
export default DoughnutChart;
原文地址:https://blog.csdn.net/weixin_44768794/article/details/126096522
本文来自互联网用户投稿,该文观点仅代表作者本人,不代表本站立场。本站仅提供信息存储空间服务,不拥有所有权,不承担相关法律责任。
如若转载,请注明出处:http://www.7code.cn/show_41250.html
如若内容造成侵权/违法违规/事实不符,请联系代码007邮箱:suwngjj01@126.com进行投诉反馈,一经查实,立即删除!
声明:本站所有文章,如无特殊说明或标注,均为本站原创发布。任何个人或组织,在未征得本站同意时,禁止复制、盗用、采集、发布本站内容到任何网站、书籍等各类媒体平台。如若本站内容侵犯了原著者的合法权益,可联系我们进行处理。