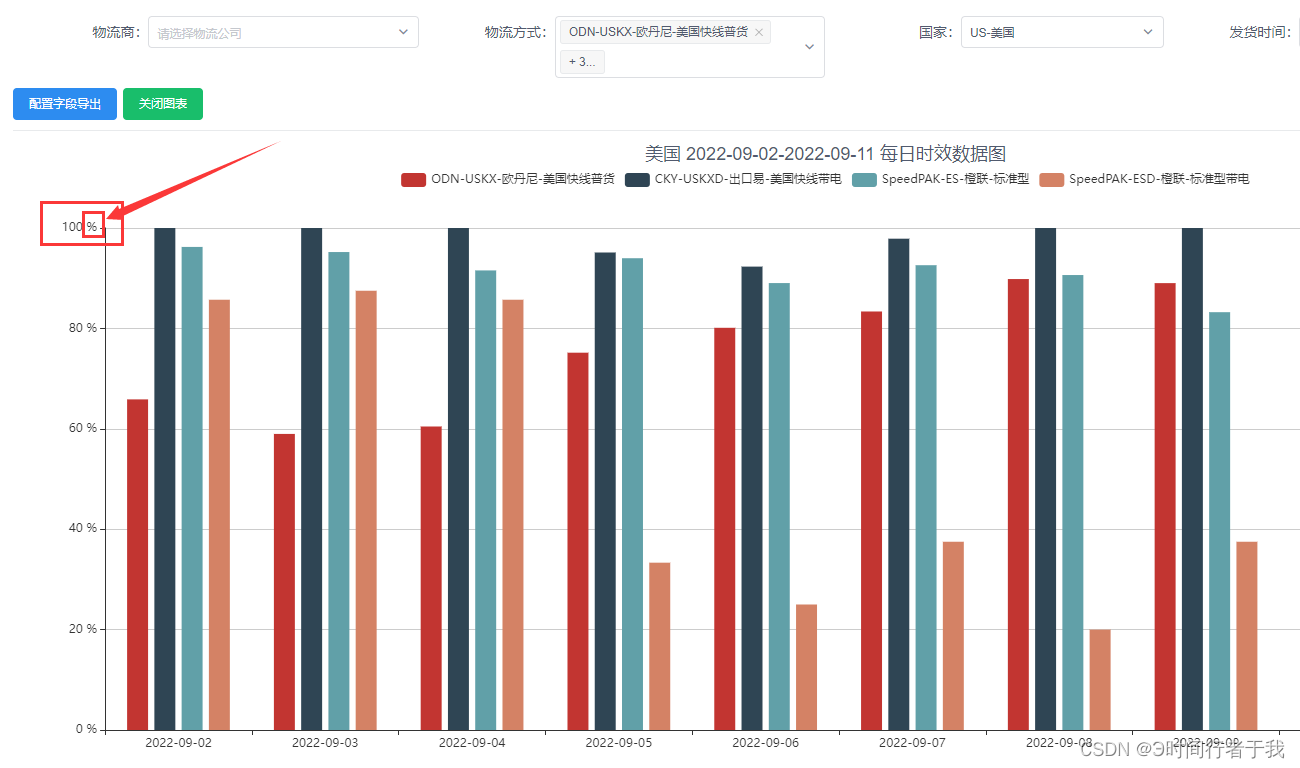
当前位置: 首页echarts正文 本文介绍: echarts折线图、柱状图中显示X,Y轴的自定义内容,如添加百分比等情况 echarts折线图、柱状图中显示X,Y轴的自定义内容,如添加百分比等情况 局部代码 以y轴为例,x轴则是相反 Y轴 yAxis: { type: 'value', min: 0,// 最小值0 max: 100, // 最大值100 axisLabel: { //添加这一段 formatter: '{value} %' } }, X轴 xAxis: { type: 'value', axisLabel: { //添加这一段 formatter: '{value} %' } }, 全部代码 setChart(isArray, LoadTime) { // echarts图表 const option = { tooltip: {}, legend: { show: true }, grid: { left: '3%', right: '4%', bottom: '3%', containLabel: true }, toolbox: { show: false, feature: { dataView: { readOnly: true } } }, xAxis: { type: 'category', data: LoadTime }, yAxis: { type: 'value', min: 0, max: 100, axisLabel: { formatter: '{value} %' // ******在这里*********** } }, series: isArray, barCategoryGap: '30%' } 原文地址:https://blog.csdn.net/qq_45094682/article/details/127008152 本文来自互联网用户投稿,该文观点仅代表作者本人,不代表本站立场。本站仅提供信息存储空间服务,不拥有所有权,不承担相关法律责任。 如若转载,请注明出处:http://www.7code.cn/show_43794.html 如若内容造成侵权/违法违规/事实不符,请联系代码007邮箱:suwngjj01@126.com进行投诉反馈,一经查实,立即删除! 主题授权提示:请在后台主题设置-主题授权-激活主题的正版授权,授权购买:RiTheme官网显示所有内容声明:本站所有文章,如无特殊说明或标注,均为本站原创发布。任何个人或组织,在未征得本站同意时,禁止复制、盗用、采集、发布本站内容到任何网站、书籍等各类媒体平台。如若本站内容侵犯了原著者的合法权益,可联系我们进行处理。echartsvalue柱状图 代码007普通 打赏 收藏 海报 链接