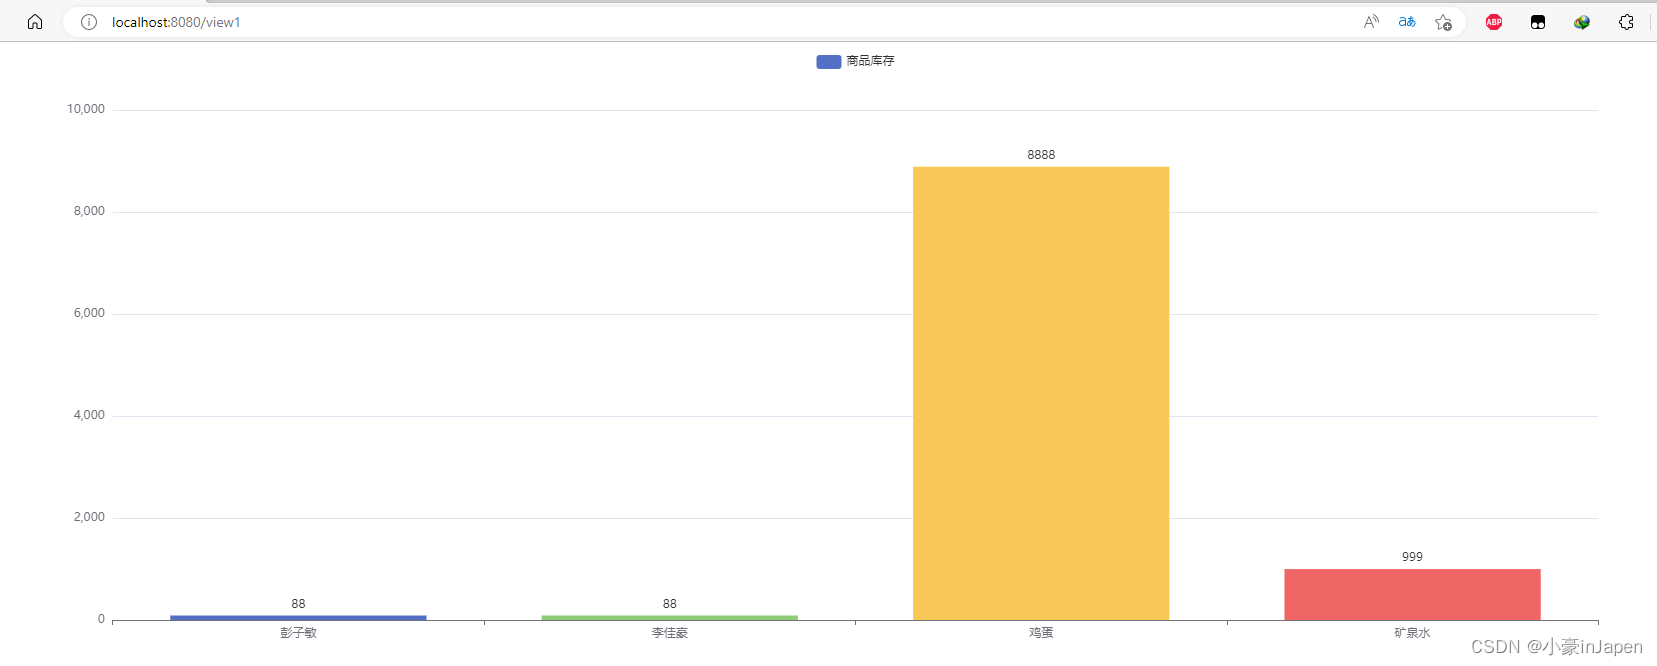
1.效果展示
1.树状图
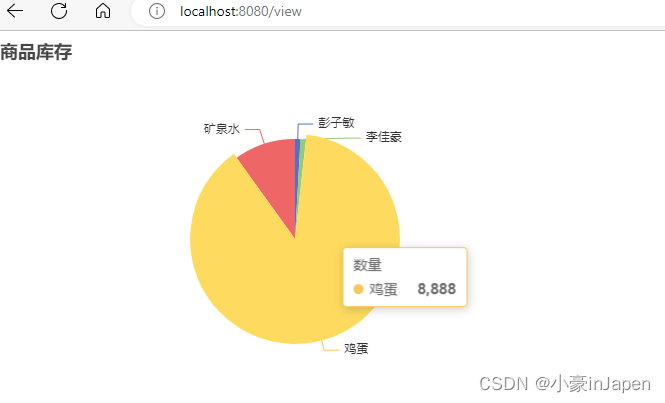
2.扇形图
2.实现步骤
<dependencies>
<dependency>
<groupId>com.baomidou</groupId>
<artifactId>mybatis-plus-boot-starter</artifactId>
<version>3.5.2</version>
</dependency>
<dependency>
<groupId>org.springframework.boot</groupId>
<artifactId>spring-boot-starter-thymeleaf</artifactId>
</dependency>
<dependency>
<groupId>org.springframework.boot</groupId>
<artifactId>spring-boot-starter-web</artifactId>
</dependency>
<dependency>
<groupId>com.mysql</groupId>
<artifactId>mysql-connector-j</artifactId>
<scope>runtime</scope>
</dependency>
<dependency>
<groupId>org.projectlombok</groupId>
<artifactId>lombok</artifactId>
<optional>true</optional>
</dependency>
<dependency>
<groupId>org.springframework.boot</groupId>
<artifactId>spring-boot-starter-test</artifactId>
<scope>test</scope>
</dependency>
</dependencies>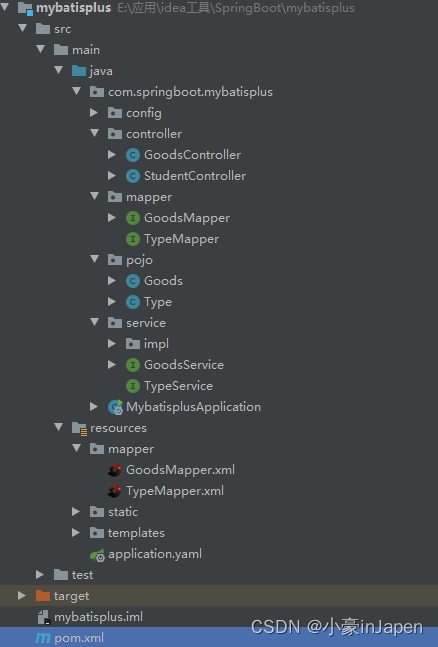
主要是这个我是和导入导出一起写的 所以有这么多东西,类和方法都是放在一起了,博客我却分开发了 谅解一下
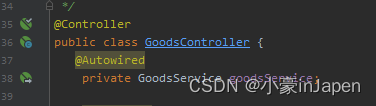
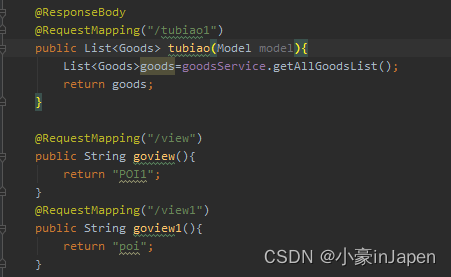
5.controller层
6.service层
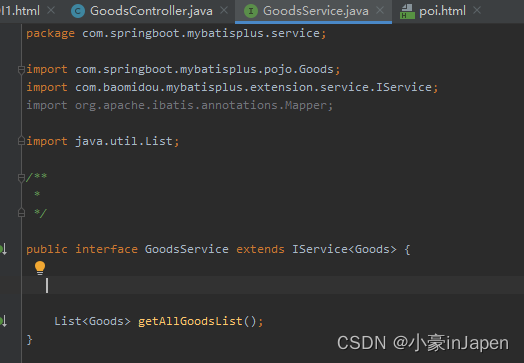
service实现类

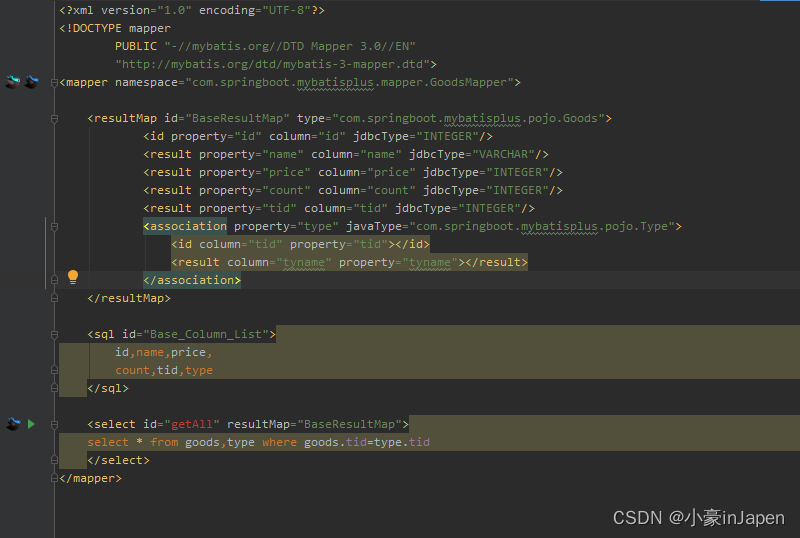
7.mapper层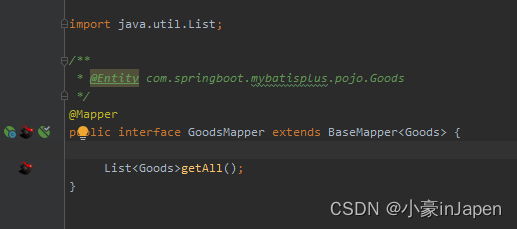
 9.
9.扇形图:
<!DOCTYPE html>
<html lang="en" xmlns:th="http://www.thymeleaf.org">
<head>
    <meta charset="UTF-8">
    <title>Title</title>
    <script src="https://cdn.jsdelivr.net/npm/echarts@5.4.0/dist/echarts.min.js"></script>
    <script src="https://code.jquery.com/jquery-3.1.1.min.js"></script>
</head>
<body>
<div id="main" style="width: 600px; height: 400px;"></div>
</body>
<script type="text/javascript">
    //初始化echarts
    function init(myChart){
        let option = {
            title:{
                text:'ECharts 数据统计'
            },
            series:[{
                name:'访问量',
                type:'pie',
                radius:'50%',
                data:[
                    {value:0,name:'无'},
                ]
            }]
        };

        myChart.setOption(option);
    }
    //从数据库读取数据赋值给echarts
    function show(myChart){
        $.ajax({
            contentType : "application/json",
            type : "GET",
            url : "/tubiao1",
            dataType : "json",
            success : function(data) {
                //创建一个数组,
                let Chart=[];
                for(let i=0;i<data.length;i++){
                    let obj={};
                    obj.name=data[i].name;
                    obj.value=data[i].count;
                    Chart[i]=obj;
                }

                myChart.setOption({
                    title:{
                        text:'商品库存'
                    },
                    tooltip:{},
                    series:[{
                        name:'数量',
                        type:'pie',
                        // radius:'10%',
                        data:Chart,
                    }]

                });

            }
        });
    }

    //初始化echarts实例
    let myChart = echarts.init(document.getElementById("main"));
    init(myChart);
    show(myChart);

</script>
</html>树状图:
<!DOCTYPE html>
<html lang="en" xmlns:th="http://www.thymeleaf.org">
<head>
    <meta charset="UTF-8">
    <title>Title</title>
    <script src="https://cdn.jsdelivr.net/npm/echarts@5.4.0/dist/echarts.min.js"></script>
    <script src="https://code.jquery.com/jquery-3.1.1.min.js"></script>
</head>
<body>
<div id="main" style="height: 40em"></div>
</body>
<script type="text/javascript">
    var myChart = echarts.init(document.getElementById('main'));

    $.ajax({
        contentType: "application/json",
        type: "GET",
        url: "/tubiao1",
        dataType: "json",
        success: function (data) {

            let x = [];
            let y = [];

            for (let i = 0; i < data.length; i++) {
                //x[i]获取json的姓名,y[i]获取json的值
                x[i] = data[i].name;
                y[i] = data[i].count;


            }

            myChart.setOption({

                tooltip: {},
                label: {
                    show: true,
                    position:'top',
                },
                legend: {},
                xAxis: {
                    data: x
                },
                yAxis: {},
                series: [
                    {
                        colorBy:'data',
                        name: '商品库存',
                        type: 'bar',
                        data: y

                    }
                ]
            });

        },
        error: function () {

        }
    })

</script>

</html>![]()
是不是很简单
总结:制作不易,如果帮助到你 请点赞收藏支持一下
如果还有纰漏请及时告知 感谢观看
原文地址:https://blog.csdn.net/weixin_61307867/article/details/128102904
本文来自互联网用户投稿,该文观点仅代表作者本人,不代表本站立场。本站仅提供信息存储空间服务,不拥有所有权,不承担相关法律责任。
如若转载,请注明出处:http://www.7code.cn/show_43876.html
如若内容造成侵权/违法违规/事实不符,请联系代码007邮箱:suwngjj01@126.com进行投诉反馈,一经查实,立即删除!
主题授权提示:请在后台主题设置-主题授权-激活主题的正版授权,授权购买:RiTheme官网
声明:本站所有文章,如无特殊说明或标注,均为本站原创发布。任何个人或组织,在未征得本站同意时,禁止复制、盗用、采集、发布本站内容到任何网站、书籍等各类媒体平台。如若本站内容侵犯了原著者的合法权益,可联系我们进行处理。