关键:
- echarts–>grid–>left :grid是直角坐标系内绘图网格,left 是grid组件离容器左侧的距离
- yAxis–>axisLabel–>margin:刻度标签与轴线之间的距离
通过canvas计算y轴文字的宽度
getTextWidth(text, font) {
let canvas = (document.createElement("canvas"));
let context = canvas.getContext("2d");
context.font = font;
let metrics = context.measureText(text);
return metrics.width;
},
// 处理x,y轴数据
handleBarData(list) { // list是接口取到的数据
this.dataX = [];
this.dataY = [];
// 深拷贝数据
let sortCopy = deepClone(list)
// 求出y轴标签最长的项
let maxlengthName = sortCopy.sort((a, b) => {
return b.dataSetName.length - a.dataSetName.length;
})[0].dataSetName;
// 计算最长的名字长度
let maxlength = maxlengthName.length
// 限制label最多显示10位,超出显示省略号
if(maxlength > 11) maxlengthName = maxlengthName.slice(0, 10) + '...'
// 求出list中label最长的长度 设置偏移量
this.yLeft = this.getTextWidth(maxlengthName,'14px Microsoft Yahei') + 30
// 清洗数据 求出x,y轴数据
list.forEach((item) => {
this.dataY.push(item.dataSetName);
this.dataX.push(item.searchNumber);
});
this.init();
},
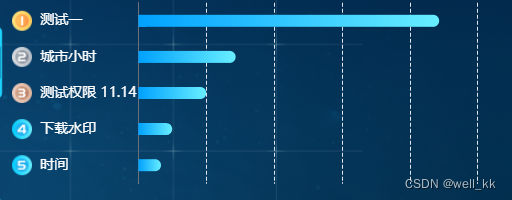
// 横向柱状图
init() {
let vueThis = this;
var myChart = vueThis.$echarts.init(
document.getElementById('t1201')
);
let option = {
tooltip: {
trigger: 'axis',
axisPointer: {
// 坐标轴指示器,坐标轴触发有效
type: 'shadow', // 默认为直线,可选为:'line' | 'shadow'
},
},
legend: {
show: false,
},
grid: {
top: '3%',
// left: 80,
left: this.yLeft,
// align:'left ',
right: '3%',
bottom: '3%',
// containLabel:true
},
xAxis: [
{
splitLine: {
show: true,
lineStyle: {
type: 'dashed',
},
},
axisLabel: {
textStyle: {
color: '#fff',
},
},
type: 'value',
show: true,
minInterval: 1,
},
],
yAxis: {
minInterval:10,
axisLine: {
//y轴
show: true,
},
type: 'category',
triggerEvent: true,
axisTick: {
show: false,
},
inverse: true,
data: this.dataY,
axisLabel: {
color: '#fff',
fontSize: 14,
// margin: 80,
margin: this.yLeft,
// 实现label前面的icon
formatter: function(value, index) {
let icon = '';
switch (index) {
case 0:
icon = 'one';
break;
case 1:
icon = 'two';
break;
case 2:
icon = 'three';
break;
case 3:
icon = 'four';
break;
case 4:
icon = 'five';
break;
}
if (value.length > 11) {
value = value.slice(0, 10) + '...';
}
return '{' + icon + '| }{value| ' + value + '}';
},
textStyle:{
align:'left',
baseline: 'middle'
},
// align: 'left',
rich: {},
},
},
series: [
{
name: this.activeTab,
type: 'bar',
barWidth: 12, // 柱子宽度
itemStyle: {
barBorderRadius: [0, 20, 20, 0], // 圆角(左上、右上、右下、左下)
color: new vueThis.$echarts.graphic.LinearGradient(
1,
0,
0,
0,
[
{
offset: 0,
color: '#68EEFF',
},
{
offset: 1,
color: '#00A1FF',
},
],
false
), // 渐变
},
data: this.dataX,
},
],
};
const richObj = {};
const formatterY = ['one', 'two', 'three', 'four', 'five'];
formatterY.forEach((item) => {
richObj[item] = {
// align: 'right',
backgroundColor: {
image: require(`@/views/visual/images/${item}.png`),
},
height: 20,
};
});
option.yAxis.axisLabel.rich = richObj;
myChart.setOption(option);
// 提示泡
this.extension(myChart);
this.$nextTick(() => {
myChart.resize();
});
},
原文地址:https://blog.csdn.net/well_kk/article/details/129358654
本文来自互联网用户投稿,该文观点仅代表作者本人,不代表本站立场。本站仅提供信息存储空间服务,不拥有所有权,不承担相关法律责任。
如若转载,请注明出处:http://www.7code.cn/show_44830.html
如若内容造成侵权/违法违规/事实不符,请联系代码007邮箱:suwngjj01@126.com进行投诉反馈,一经查实,立即删除!
主题授权提示:请在后台主题设置-主题授权-激活主题的正版授权,授权购买:RiTheme官网
声明:本站所有文章,如无特殊说明或标注,均为本站原创发布。任何个人或组织,在未征得本站同意时,禁止复制、盗用、采集、发布本站内容到任何网站、书籍等各类媒体平台。如若本站内容侵犯了原著者的合法权益,可联系我们进行处理。