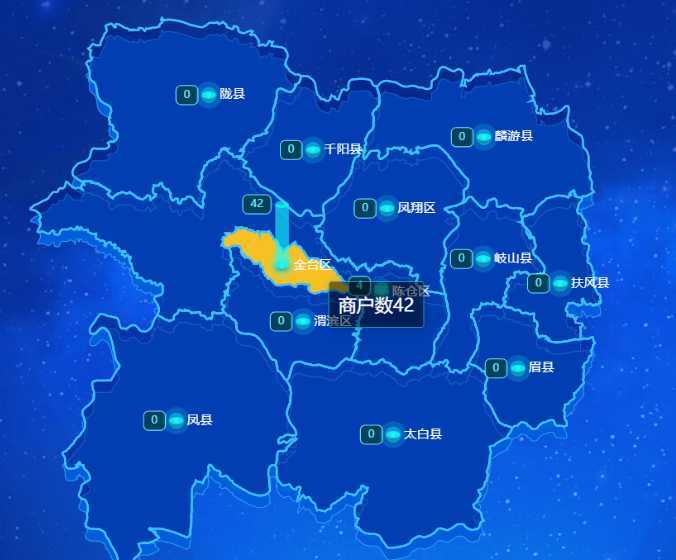
先引入echarts和在echats社区下载对应地图省份的JSON数据,在调接口拿数据的时候如果出现柱状图没出现的问题,要确保后端返回的信息和center和center2中的name名字完全一致,因为后面根据name遍历数组,有其他问题可以私信
<template>
<div class="baojimap" ref="baojimap" id="baojimap" style="height: 100%;width: 100%;"></div>
</template>
<script>
import baoji from "@/assets/json/610300.json";
export default {
data() {
return {
datasss : [
// { name: "渭滨区", value: 0 },
// { name: "金台区", value: 42 },
// { name: "陈仓区", value: 0 },
// { name: "凤翔区", value: 0 },
// { name: "岐山县", value: 0 },
// { name: "扶风县", value: 0 },
// { name: "眉县", value: 0 },
// { name: "陇县", value: 0 },
// { name: "千阳县", value: 0 },
// { name: "麟游县", value: 0 },
// { name: "凤县", value: 0 },
// { name: "太白县", value: 0 },
],
areaMap:'',
};
},
mounted() {
this.$nextTick(()=>{
// this.init();
this.getMapList()
})
},
methods: {
init() {
const that = this;
var chartDom = document.getElementById("baojimap");
var myChart = this.$echarts.init(chartDom);
window.addEventListener("resize", function () {
myChart.resize();
});
myChart.off("click");
this.$echarts.registerMap("js", baoji);
this.$echarts.registerMap("js2", baoji);
// console.log(baoji);
var aaa = []
function sss(baoji){
// console.log(baoji);
aaa = baoji.features.map((item)=>{
return {
value: (Math.random() * 1000).toFixed(2),
name:item.properties.name
}
});
// console.log(aaa);
}
sss(baoji)
var option;
// 柱状图 图中的位置
var center = {
渭滨区: [107.144467, 34.271008],
金台区: [107.080003, 34.425192],
陈仓区: [107.383645, 34.352747],
凤翔区: [107.400577, 34.581668],
岐山县: [107.694464, 34.44296],
扶风县: [107.929419, 34.375497],
眉县: [107.799971, 34.142137],
陇县: [106.857066, 34.893262],
千阳县: [107.174987, 34.742584],
麟游县: [107.696608, 34.777714],
凤县: [106.758122, 33.998464],
太白县: [107.419533, 33.960015],
};
// 图中 省份字的位置
var center2 = {
渭滨区: [107.144467, 34.271008],
金台区: [107.080003, 34.425192],
陈仓区: [107.383645, 34.352747],
凤翔区: [107.400577, 34.581668],
岐山县: [107.694464, 34.44296],
扶风县: [107.929419, 34.375497],
眉县: [107.799971, 34.142137],
陇县: [106.857066, 34.893262],
千阳县: [107.174987, 34.742584],
麟游县: [107.696608, 34.777714],
凤县: [106.758122, 33.998464],
太白县: [107.419533, 33.960015],
};
// 数据
var dataw = that.datasss;
console.log(dataw);
var lineData = dataw.map((item) => {
// debugger
console.log(item);
return {
coords: [
center[item.name],
[center[item.name][0], center[item.name][1] + item.value * 4 * 0.001],
],
};
});
var scatterData = dataw.map((item) => {
return [
center[item.name][0],
center[item.name][1] + item.value * 4 * 0.001,
];
});
var scatterData2 = dataw.map((item) => {
return center[item.name];
});
var scatterData3 = dataw.map((item) => {
return center2[item.name].concat(item.name);
});
console.log(lineData,scatterData,scatterData2,scatterData3);
option = {
backgroundColor: "rgba(0,0,0,0)",
tooltip: {
trigger: 'item',
show: true,
enterable: true,
textStyle:{
fontSize:20,
color: '#fff'
},
backgroundColor: 'rgba(0,0,0,0.5)',
// backgroundColor: 'rgba(0,2,89,0.8)',
// formatter: '{b}'
formatter: function (item) {
var aaaaa = dataw
return `商户数${aaaaa[item.dataIndex].value}`;
},
},
// 地图图层样式
geo: [
{
map: "js",
aspectScale: 0.9,
roam: false, //是否允许缩放
// roam:true,
//zoom: 1.1, //默认显示级别
layoutSize: "95%",
layoutCenter: ["50%", "50%"],
itemStyle: {
areaColor: "transparent",
borderColor: "#37C1FD",
borderWidth: 2,
},
emphasis: {
itemStyle: {
areaColor: "#72b2ff",
},
label: {
show: 0,
color: "#fff",
},
},
zlevel: 3,
regions: [ // 区域配置
{
name: '金台区', //区块名称
itemStyle: {
normal: {
areaColor: 'rgb(247, 192, 35)' // 区域颜色
}
}
},
]
},
{
map: "js2",
aspectScale: 0.9,
roam: false, //是否允许缩放
//zoom: 1.1, //默认显示级别
layoutSize: "95%",
layoutCenter: ["50%", "50%"],
itemStyle: {
areaColor: {
type: "radial",
x: 0.7,
y: 0.5,
r: 0.4,
colorStops: [
{
offset: 0,
//color: "#72b2ff", // 0% 处的颜色
// color:"rgba(8, 79, 207)"
color:"rgba(1, 32, 137,0.5)"
},
{
offset: 1,
color: "rgba(1, 32, 137,0.5)", // 100% 处的颜色
},
],
global: false, // 缺省为 false
},
borderColor: "#37C1FD",
borderWidth: 2,
},
zlevel: 2,
silent: true,
},
{
map: "js2",
aspectScale: 0.9,
roam: false, //是否允许缩放
//zoom: 1.1, //默认显示级别
layoutSize: "95%",
layoutCenter: ["50%", "52%"],
itemStyle: {
areaColor: "#005DDC",
borderColor: "#329BF5",
borderWidth: 1,
},
zlevel: 1,
silent: true,
},
],
series: [
// 画柱状图
{
type: "lines",
zlevel: 5,
effect: {
show: false,
period: 4, //箭头指向速度,值越小速度越快
trailLength: 0.02, //特效尾迹长度[0,1]值越大,尾迹越长重
symbol: "arrow", //箭头图标
symbolSize: 5, //图标大小
},
lineStyle: {
width: 15, //尾迹线条宽度
color: 'rgb(22,255,255, .6)',
opacity: 1, //尾迹线条透明度
curveness: 0, //尾迹线条曲直度
},
label: {
show: 0,
position: "end",
formatter: "245",
},
silent: true,
data: lineData,
},
// 柱形数量显示
{
type: "scatter",
coordinateSystem: "geo",
geoIndex: 0,
zlevel: 5,
label: {
show: !0,
position: "left",
formatter: (params) => dataw[params.dataIndex].value,
padding: [4, 8],
backgroundColor: "#003F5E",
borderRadius: 5,
borderColor: "#67F0EF",
borderWidth: 1,
color: "#67F0EF",
},
symbol: "circle",
symbolSize: [15, 8],
itemStyle: {
color: 'rgb(22,255,255, .6)',
opacity: 1,
},
silent: true,
data: scatterData,
},
// 图中圆点设置
{
type: "scatter",
coordinateSystem: "geo",
geoIndex: 0,
zlevel: 5,
symbol: "circle",
symbolSize: [15, 8],
itemStyle: {
color: 'rgb(22,255,255, .6)',
opacity: 1,
shadowColor: "#000",
shadowBlur: 5,
shadowOffsetY: 2,
},
silent: true,
data: scatterData2,
},
{
type: "effectScatter",
coordinateSystem: "geo",
geoIndex: 0,
symbol: "circle",
symbolSize: 4,
showEffectOn: "render",
rippleEffect: {
brushType: "fill",
scale: 10,
},
hoverAnimation: true,
label: {
formatter: (p) => p.data[2],
position: "right",
color: "#fff",
fontSize: 14,
distance: 10,
show: !0,
},
itemStyle: {
color: 'rgb(22,255,255, .6)',
},
zlevel: 6,
data: scatterData3,
},
],
};
myChart.setOption(option);
// 地图中高亮的省份 ,this.areaMap为地区名
myChart.on("globalout",()=>{
setTimeout(()=>{
showTips(this.areaMap)
},1000)
})
function showTips(name) {
aaa.forEach((item,i)=>{
if (item.name.includes(name)) {
myChart.dispatchAction({
type: 'showTip',
seriesIndex: 0,
dataIndex: i
});
myChart.dispatchAction({
type: 'mapSelect',
seriesIndex: 0,
dataIndex: i
});
}
});
}
},
//接口
async getMapList(){
await this.$axios.post("/api/v2/index/HomeMapData").then((res)=>{
if(res.data.code === 200){
// console.log(res);
this.datasss = res.data.data.data
this.areaMap = res.data.data.areaName
// 在拿到数据后再调用echarts,防止echarts在没拿到数据之前渲染
this.init();
console.log(this.datasss);
}
})
}
},
};
</script>
<style>
.baojimap {
height: 100%;
width: 100%;
}
</style>
原文地址:https://blog.csdn.net/zhanglongle_/article/details/129032174
本文来自互联网用户投稿,该文观点仅代表作者本人,不代表本站立场。本站仅提供信息存储空间服务,不拥有所有权,不承担相关法律责任。
如若转载,请注明出处:http://www.7code.cn/show_46192.html
如若内容造成侵权/违法违规/事实不符,请联系代码007邮箱:suwngjj01@126.com进行投诉反馈,一经查实,立即删除!
主题授权提示:请在后台主题设置-主题授权-激活主题的正版授权,授权购买:RiTheme官网
声明:本站所有文章,如无特殊说明或标注,均为本站原创发布。任何个人或组织,在未征得本站同意时,禁止复制、盗用、采集、发布本站内容到任何网站、书籍等各类媒体平台。如若本站内容侵犯了原著者的合法权益,可联系我们进行处理。


