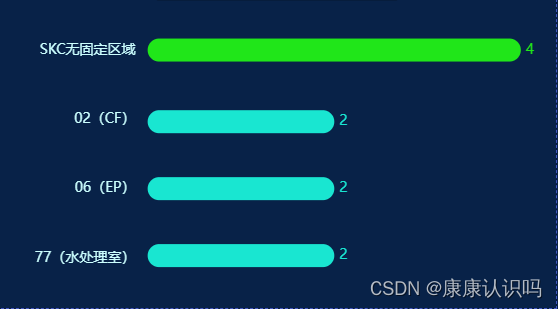
let datas = [];
let a = dataset;
for(var i in dataset) {
     datas[i]=dataset[i].施工人数;
}
// console.log(datas);
let titlename = [];
for(var i in dataset) {
     titlename[i]=dataset[i].施工区域;
}
let colorlist = []
function hslaTo(h) {
                  var h = h ;
                  colorlist.push(h);
                  return h;
                }

option = {
      backgroundColor: 'rgba(0,0,0,0)',
      grid: {
        top: "5%",
        right: "5%",
        left: "27%",
        bottom: "5%",
      },
        dataZoom: [
          //滑动条
          {
            yAxisIndex: 0, //这里是从X轴的0刻度开始
            show: false, //是否显示滑动条,不影响使用
            type: "slider", // 这个 dataZoom 组件是 slider 型 dataZoom 组件
            startValue: 0, // 从头开始。
            endValue: 4, // 一次性展示5个。
          },
        ],
  xAxis: {
    show: false,
  },
  yAxis: [
    {
      show: true,
      data: titlename,
      inverse: true,
      axisLine: {
        show: false,
      },
      splitLine: {
        show: false,
      },
      axisTick: {
        show: false,
      },
      axisLabel: {
        textStyle: {
          color: '#ccffff',
          fontSize : 14,

        },
        formatter: function (value, index) {
          return ["{title|" + value + "} "].join("n");
        },
        rich: {},
      },
    },

  ],

  series: [
    {
      name: "条",
      type: "bar",
      yAxisIndex: 0,
      data: datas,
      barWidth: '23px',
      itemStyle: {
        normal: {
          barBorderRadius: 30,
          color: function (params) {
           if(params.data <= 10){
                    let a = ('hsla('+ (230 - params.data * 28)+','+ '80%'+','+ '50%'+','+ (params.data * 100 )+')');
                    return(hslaTo(a));
              }else{
                   let a = 'rgba(168,25,230,100)'
                   return(hslaTo(a));
              }
          },
        },
      },
      label: {
        normal: {
          show: true,
          position: 'right',
          formatter: "{c}",
          fontSize : 14,
          color:'inherit',
        },
      },
    },
  ],
};
    setInterval(function () {
        // 每次向后滚动一个,最后一个从头开始。
        // console.log(option.dataZoom[0].endValue);
        // console.log("---"+KSMC.length);

    if (option.dataZoom[0].endValue == datas.length) {
          option.dataZoom[0].endValue = 4;
          option.dataZoom[0].startValue = 0;
    } else {
          option.dataZoom[0].endValue = option.dataZoom[0].endValue + 1;
          option.dataZoom[0].startValue = option.dataZoom[0].startValue + 1;
        }
        myChart.setOption(option);
    }, 2000);
例二,竖向的:
let da = []
let dat = dataset[0].source
let dats = []
for(var i in dat) {
     da[i]=dat[i][0]
}
for(var i in dat) {
     dats[i]=dat[i][1]
}
    option = {
      backgroundColor: "#00265f",
      title: {
        text: "",
        x: "center",
        y: "4%",
        textStyle: {
          color: "#fff",
          fontSize: "22",
        },
        subtextStyle: {
          color: "#90979c",
          fontSize: "16",
        },
      },
      tooltip: {
        trigger: "axis",
        axisPointer: {
          type: "shadow",
        },
      },
      grid: {
        top: "15%",
        right: "3%",
        left: "5%",
        bottom: "12%",
      },
      dataZoom: [
          //滑动条
          {
            xAxisIndex: 0, //这里是从X轴的0刻度开始
            show: false, //是否显示滑动条,不影响使用
            type: "slider", // 这个 dataZoom 组件是 slider 型 dataZoom 组件
            startValue: 0, // 从头开始。
            endValue: 6, // 一次性展示6个。
          },
        ],
      xAxis: [
        {
          type: "category",
          data: da,
          axisLine: {
            lineStyle: {
              color: "rgba(255,255,255,0.12)",
            },
          },
          axisLabel: {
            interval:0,
            margin: 10,
            color: "#e2e9ff",
            textStyle: {
              fontSize: 14,
            },
          },
        },
      ],
      yAxis: [
        {
          name: "单位",
          axisLabel: {
            formatter: "{value}",
            color: "#e2e9ff",
          },
          axisLine: {
            show: false,
            lineStyle: {
              color: "rgba(255,255,255,1)",
            },
          },
          splitLine: {
            lineStyle: {
              color: "rgba(255,255,255,0.12)",
            },
          },
        },
      ],
      series: [
        {
          type: "bar",
          data: dats,
          barWidth: "20px",
          itemStyle: {
            normal: {
              color: new echarts.graphic.LinearGradient(
                0,
                0,
                0,
                1,
                [
                  {
                    offset: 0,
                    color: "rgba(0,244,255,1)", // 0% 处的颜色
                  },
                  {
                    offset: 1,
                    color: "rgba(0,77,167,1)", // 100% 处的颜色
                  },
                ],
                false
              ),
              barBorderRadius: [30, 30, 30, 30],
              shadowColor: "rgba(0,160,221,1)",
              shadowBlur: 4,
            },
          },
          label: {
            normal: {
              show: true,
              lineHeight: 18,
              width: 40,
              height: 18,
              backgroundColor: "rgba(0,160,221,0.1)",
              borderRadius: 200,
              position: ["-8", "-36"],
              distance: 1,
              formatter: ["   {d|●} " ," {a|{c}}    n" , "    {b|}"].join(","),
              rich: {
                d: {
                  color: "#3CDDCF",
                },
                a: {
                  color: "#fff",
                  align: "center",
                },
                b: {
                  width: 1,
                  height: 18,
                  borderWidth: 1,
                  borderColor: "#234e6c",
                  align: "left",
                },
              },
            },
          },
        },
      ],
    };
    setInterval(function () {
        // 每次向后滚动一个,最后一个从头开始。
        // console.log(option.dataZoom[0].endValue);
        // console.log("---"+KSMC.length);

    if (option.dataZoom[0].endValue == da.length) {
          option.dataZoom[0].endValue = 6;
          option.dataZoom[0].startValue = 0;
    } else {
          option.dataZoom[0].endValue = option.dataZoom[0].endValue + 1;
          option.dataZoom[0].startValue = option.dataZoom[0].startValue + 1;
        }
        myChart.setOption(option);
    }, 2000);
原文地址:https://blog.csdn.net/weixin_44822684/article/details/134535177
本文来自互联网用户投稿,该文观点仅代表作者本人,不代表本站立场。本站仅提供信息存储空间服务,不拥有所有权,不承担相关法律责任。
如若转载,请注明出处:http://www.7code.cn/show_47742.html
如若内容造成侵权/违法违规/事实不符,请联系代码007邮箱:suwngjj01@126.com进行投诉反馈,一经查实,立即删除!
主题授权提示:请在后台主题设置-主题授权-激活主题的正版授权,授权购买:RiTheme官网
声明:本站所有文章,如无特殊说明或标注,均为本站原创发布。任何个人或组织,在未征得本站同意时,禁止复制、盗用、采集、发布本站内容到任何网站、书籍等各类媒体平台。如若本站内容侵犯了原著者的合法权益,可联系我们进行处理。


