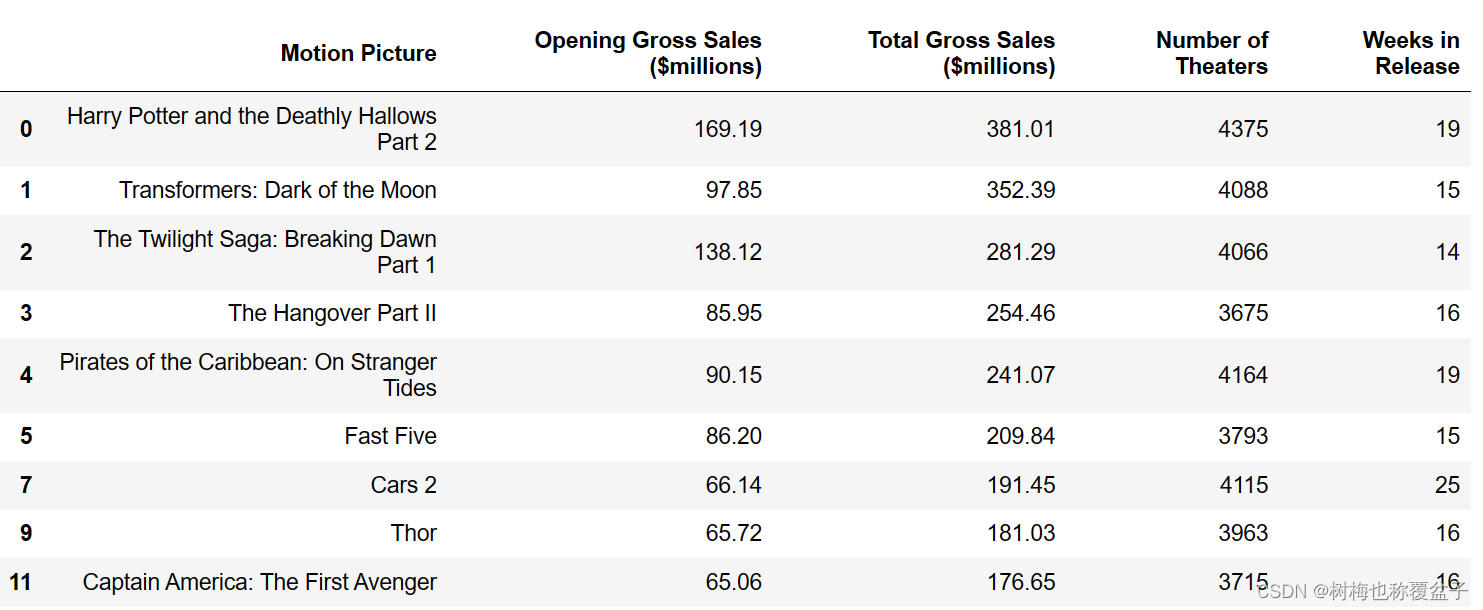
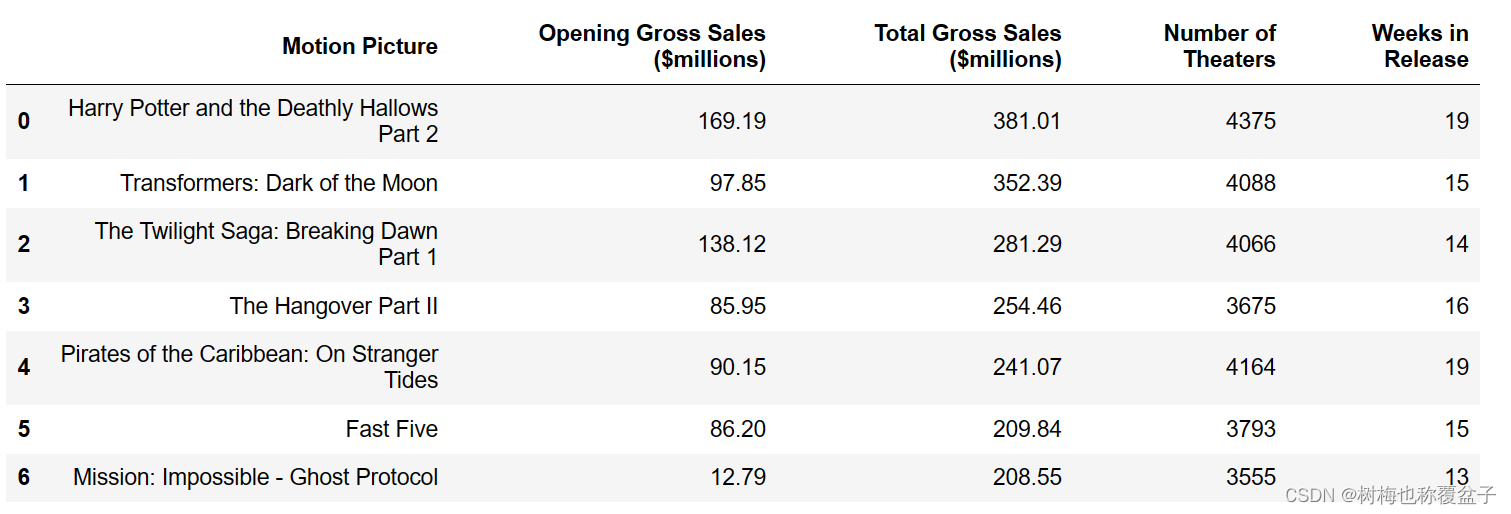
本文介绍: 从票房角度来看:Harry Potter and the Deathly Hallows Part 2 、Transformers: Dark of the Moon、The Twilight Saga: Breaking Dawn Part 1、The Hangover Part II、Pirates of the Caribbean: On Stranger Tides、Fast Five共6部电影不仅是首映票房还是总票房都异常高于其他电影。2.如果有,哪些电影被认为是优异表现的异常值,请解释。
要求
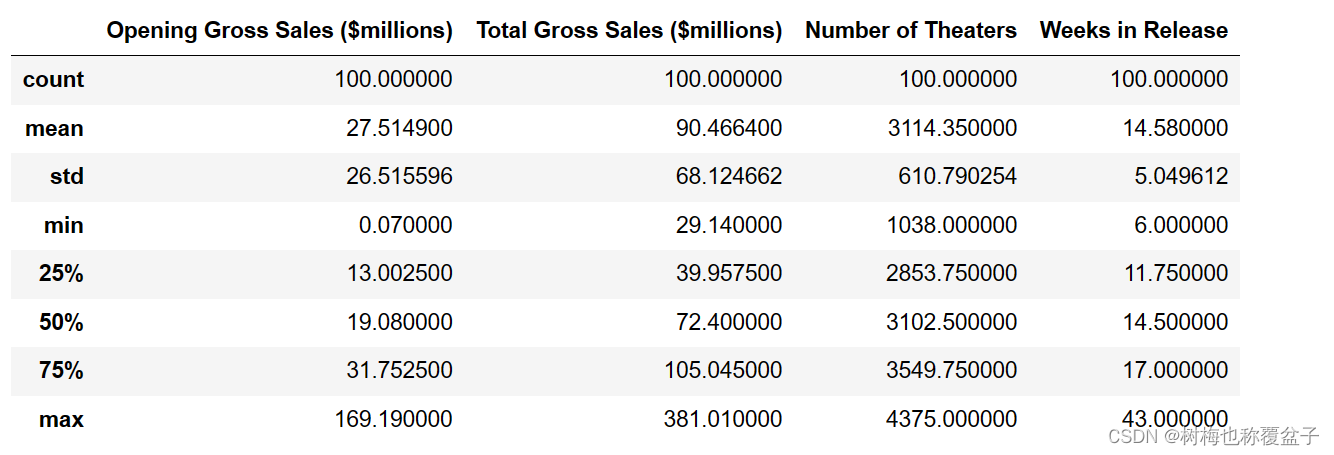
1.四个变量中每个变量的描述统计量,接着对每个描述统计量得出关于电影业的情况进行讨论
2.如果有,哪些电影被认为是优异表现的异常值,请解释。
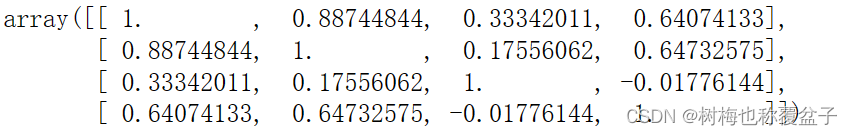
3.列出总票房收入与每一个其他变量之间关系的描述统计量,请解释。
Python实现
1.四个变量中每个变量的描述统计量,接着每个描述统计量得出的关于电影业的情况进行讨论。
相关描述性统计的分析可查看:2-2电影业
2.如果有,哪些电影被认为是优异表现的异常值,请解释。
下面是以四分位数的方式查找异常优秀的电影:
声明:本站所有文章,如无特殊说明或标注,均为本站原创发布。任何个人或组织,在未征得本站同意时,禁止复制、盗用、采集、发布本站内容到任何网站、书籍等各类媒体平台。如若本站内容侵犯了原著者的合法权益,可联系我们进行处理。