本文介绍: ECharts 图表简单示例,中国地图
目录
ECharts官网链接: ECharts
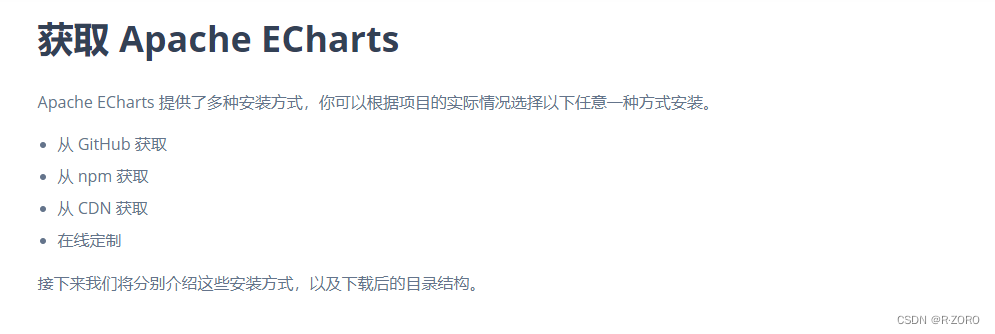
在项目中引入 Apache ECharts
<!DOCTYPE html>
<html>
  <head>
    <meta charset="utf-8" />
    <!-- 引入刚刚下载的 ECharts 文件 -->
    <script src="echarts.js"></script>
    <!-- 地图js -->
    <script src="china.js"></script>
  </head>
</html>
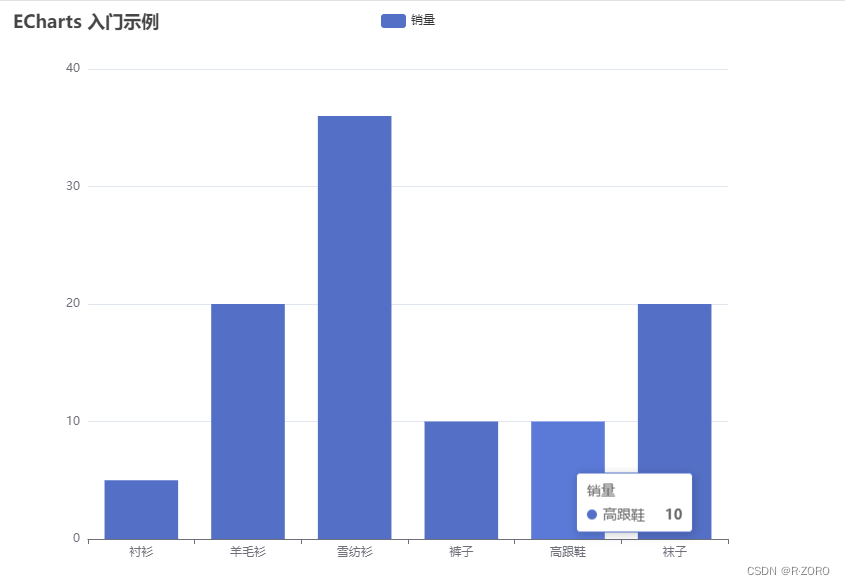
柱状图
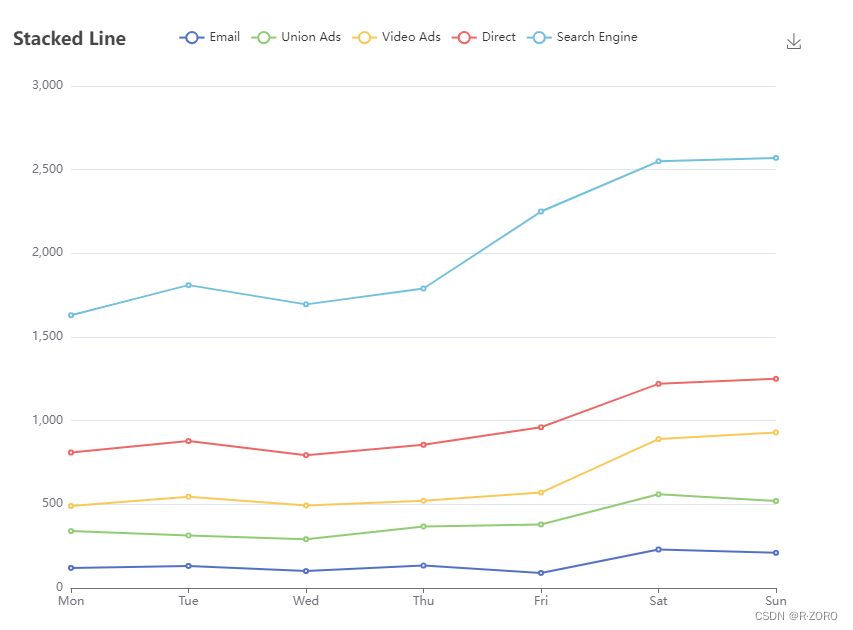
折线图
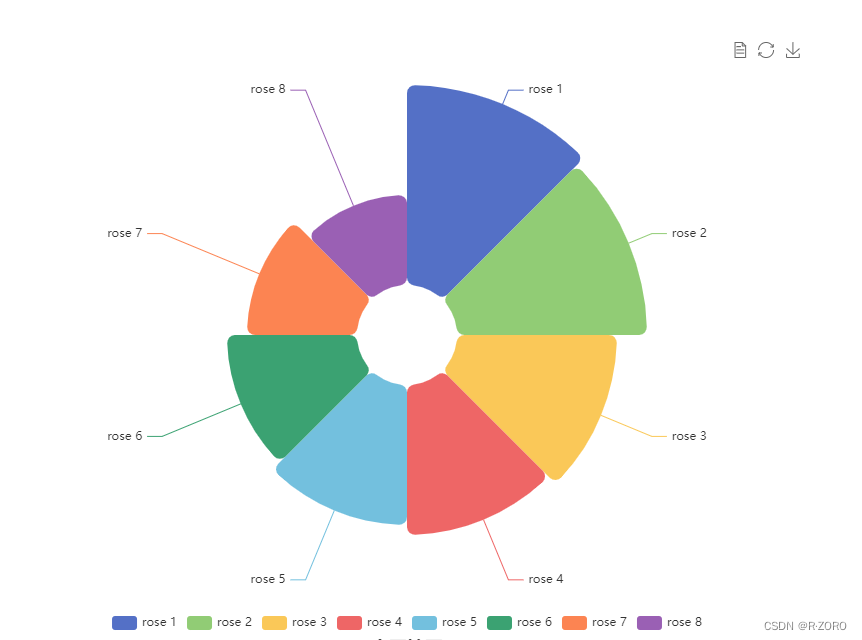
饼图
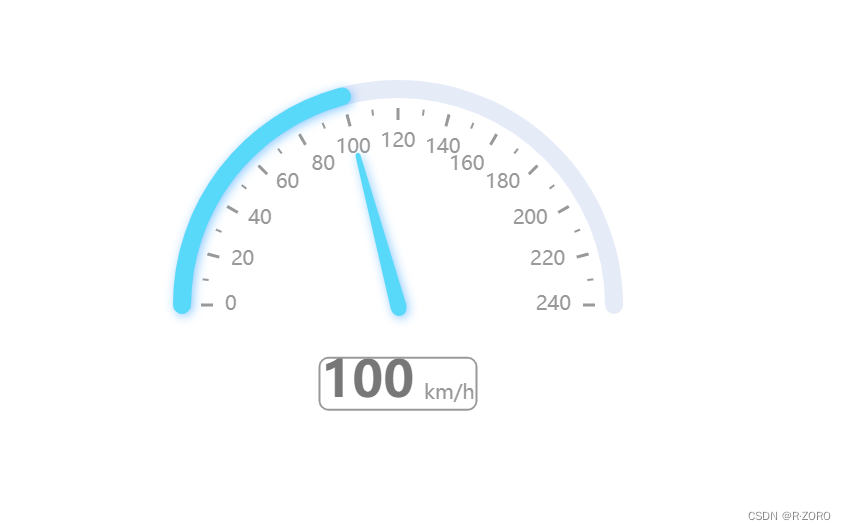
仪表盘
中国地图
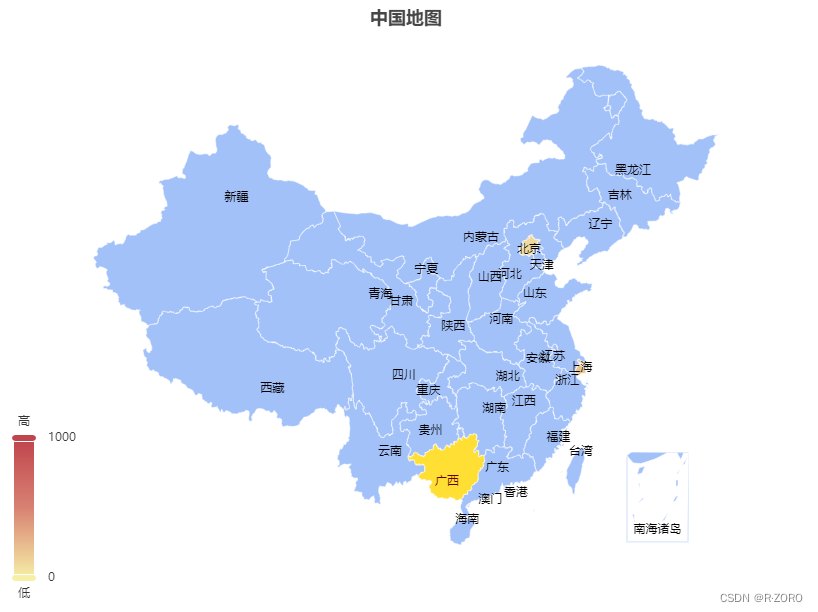
完整示例代码
<!DOCTYPE html>
<html lang="en">
<head>
<meta charset="UTF-8">
<meta name="viewport" content="width=device-width, initial-scale=1.0">
<title>Document</title>
<!-- 引入刚刚下载的 ECharts 文件 -->
<script src="echarts.js"></script>
<!-- 地图js -->
<script src="china.js"></script>
</head>
<body>
<!-- 为 ECharts 准备一个定义了宽高的 DOM -->
<div id="main1" style="width: 800px;height:600px;"></div>
<div id="main2" style="width: 800px;height:600px;"></div>
<div id="main3" style="width: 800px;height:600px;"></div>
<div id="main4" style="width: 800px;height:600px;"></div>
<div id="map" style="width: 800px;height:600px;"></div>
<script type="text/javascript">
// 基于准备好的dom,初始化echarts实例
var chartDom1 = document.getElementById('main1');
var chartDom2 = document.getElementById('main2');
var chartDom3 = document.getElementById('main3');
var chartDom4 = document.getElementById('main4');
var chartDom5 = document.getElementById('map');
var myChart1 = echarts.init(chartDom1);
var myChart2 = echarts.init(chartDom2);
var myChart3 = echarts.init(chartDom3);
var myChart4 = echarts.init(chartDom4);
var myChart5 = echarts.init(chartDom5);
var option1, option2, option3, option4, option5;
// 指定图表的配置项和数据
var option1 = {
title: {
text: 'ECharts 入门示例'
},
tooltip: {},
legend: {
data: ['销量']
},
xAxis: {
data: ['衬衫', '羊毛衫', '雪纺衫', '裤子', '高跟鞋', '袜子']
},
yAxis: {},
series: [{
name: '销量',
type: 'bar',
data: [5, 20, 36, 10, 10, 20]
}]
};
// 使用刚指定的配置项和数据显示图表。
myChart1.setOption(option1);
option2 = {
title: {
text: 'Stacked Line'
},
tooltip: {
trigger: 'axis'
},
legend: {
data: ['Email', 'Union Ads', 'Video Ads', 'Direct', 'Search Engine']
},
grid: {
left: '3%',
right: '4%',
bottom: '3%',
containLabel: true
},
toolbox: {
feature: {
saveAsImage: {}
}
},
xAxis: {
type: 'category',
boundaryGap: false,
data: ['Mon', 'Tue', 'Wed', 'Thu', 'Fri', 'Sat', 'Sun']
},
yAxis: {
type: 'value'
},
series: [{
name: 'Email',
type: 'line',
stack: 'Total',
data: [120, 132, 101, 134, 90, 230, 210]
},
{
name: 'Union Ads',
type: 'line',
stack: 'Total',
data: [220, 182, 191, 234, 290, 330, 310]
},
{
name: 'Video Ads',
type: 'line',
stack: 'Total',
data: [150, 232, 201, 154, 190, 330, 410]
},
{
name: 'Direct',
type: 'line',
stack: 'Total',
data: [320, 332, 301, 334, 390, 330, 320]
},
{
name: 'Search Engine',
type: 'line',
stack: 'Total',
data: [820, 932, 901, 934, 1290, 1330, 1320]
}
]
};
myChart2.setOption(option2);
option3 = {
series: [{
type: 'gauge',
startAngle: 180,
endAngle: 0,
min: 0,
max: 240,
splitNumber: 12,
itemStyle: {
color: '#58D9F9',
shadowColor: 'rgba(0,138,255,0.45)',
shadowBlur: 10,
shadowOffsetX: 2,
shadowOffsetY: 2
},
progress: {
show: true,
roundCap: true,
width: 18
},
pointer: {
icon: 'path://M2090.36389,615.30999 L2090.36389,615.30999 C2091.48372,615.30999 2092.40383,616.194028 2092.44859,617.312956 L2096.90698,728.755929 C2097.05155,732.369577 2094.2393,735.416212 2090.62566,735.56078 C2090.53845,735.564269 2090.45117,735.566014 2090.36389,735.566014 L2090.36389,735.566014 C2086.74736,735.566014 2083.81557,732.63423 2083.81557,729.017692 C2083.81557,728.930412 2083.81732,728.84314 2083.82081,728.755929 L2088.2792,617.312956 C2088.32396,616.194028 2089.24407,615.30999 2090.36389,615.30999 Z',
length: '75%',
width: 16,
offsetCenter: [0, '5%']
},
axisLine: {
roundCap: true,
lineStyle: {
width: 18
}
},
axisTick: {
splitNumber: 2,
lineStyle: {
width: 2,
color: '#999'
}
},
splitLine: {
length: 12,
lineStyle: {
width: 3,
color: '#999'
}
},
axisLabel: {
distance: 30,
color: '#999',
fontSize: 20
},
title: {
show: false
},
detail: {
backgroundColor: '#fff',
borderColor: '#999',
borderWidth: 2,
width: '60%',
lineHeight: 40,
height: 40,
borderRadius: 8,
offsetCenter: [0, '35%'],
valueAnimation: true,
formatter: function (value) {
return '{value|' + value.toFixed(0) + '}{unit|km/h}';
},
rich: {
value: {
fontSize: 50,
fontWeight: 'bolder',
color: '#777'
},
unit: {
fontSize: 20,
color: '#999',
padding: [0, 0, -20, 10]
}
}
},
data: [{
value: 100
}]
}]
};
// 使用刚指定的配置项和数据显示图表。
myChart3.setOption(option3);
option4 = {
legend: {
top: 'bottom'
},
toolbox: {
show: true,
feature: {
mark: {
show: true
},
dataView: {
show: true,
readOnly: false
},
restore: {
show: true
},
saveAsImage: {
show: true
}
}
},
series: [{
name: 'Nightingale Chart',
type: 'pie',
radius: [50, 250],
center: ['50%', '50%'],
roseType: 'area',
itemStyle: {
borderRadius: 8
},
data: [{
value: 40,
name: 'rose 1'
},
{
value: 38,
name: 'rose 2'
},
{
value: 32,
name: 'rose 3'
},
{
value: 30,
name: 'rose 4'
},
{
value: 28,
name: 'rose 5'
},
{
value: 26,
name: 'rose 6'
},
{
value: 22,
name: 'rose 7'
},
{
value: 18,
name: 'rose 8'
}
]
}]
};
// 使用刚指定的配置项和数据显示图表。
myChart4.setOption(option4);
// 自定义蓝色调颜色
var itemColor = '#A2C1F9'; // 蓝色
// 配置地图选项
var option5 = {
title: {
text: '中国地图',
left: 'center'
},
tooltip: {
trigger: 'item'
},
visualMap: {
min: 0,
max: 1000,
left: 'left',
top: 'bottom',
text: ['高', '低'], // 图例文字
calculable: true
},
series: [{
name: '地图',
type: 'map',
mapType: 'china',
roam: false, // 禁止地图缩放和平移
label: {
show: true,
color: '#000'
},
itemStyle: {
normal: {
areaColor: itemColor, // 设置各个区域的颜色
borderColor: '#fff' // 省份边界颜色
},
emphasis: {
areaColor: '#F3B329', // 高亮省份的颜色
shadowOffsetX: 0,
shadowOffsetY: 0,
shadowBlur: 20,
borderWidth: 0,
shadowColor: 'rgba(0, 0, 0, 0.5)'
}
},
data: [{
name: '北京',
value: 100
},
{
name: '上海',
value: 200
},
{
name: '广州',
value: 300
},
// 其他省份的数据
]
}]
};
// 使用刚指定的配置项和数据显示图表
myChart5.setOption(option5);
</script>
</body>
</html>
原文地址:https://blog.csdn.net/qq_46029887/article/details/135460377
本文来自互联网用户投稿,该文观点仅代表作者本人,不代表本站立场。本站仅提供信息存储空间服务,不拥有所有权,不承担相关法律责任。
如若转载,请注明出处:http://www.7code.cn/show_54614.html
如若内容造成侵权/违法违规/事实不符,请联系代码007邮箱:suwngjj01@126.com进行投诉反馈,一经查实,立即删除!
主题授权提示:请在后台主题设置-主题授权-激活主题的正版授权,授权购买:RiTheme官网
声明:本站所有文章,如无特殊说明或标注,均为本站原创发布。任何个人或组织,在未征得本站同意时,禁止复制、盗用、采集、发布本站内容到任何网站、书籍等各类媒体平台。如若本站内容侵犯了原著者的合法权益,可联系我们进行处理。


