本文介绍: 本例中使用的 fabric 版本为 2.4.1。
本例中使用的 fabric 版本为 2.4.1
修改 orderer , peer 节点 docker-compose 文件
orderer 节点:
environment:
   - ORDERER_METRICS_PROVIDER=prometheus
   - ORDERER_OPERATIONS_LISTENADDRESS=0.0.0.0:8443
ports:
   - 8443:8443
peer 节点:
environment:
   - CORE_METRICS_PROVIDER=prometheus
   - CORE_OPERATIONS_LISTENADDRESS=0.0.0.0:8443
ports:
   - 8443:8443
编写 prometheus.yml
global:
  scrape_interval:     15s # Set the scrape interval to every 15 seconds. Default is every 1 minute.
  evaluation_interval: 15s # Evaluate rules every 15 seconds. The default is every 1 minute.
  # scrape_timeout is set to the global default (10s).

# Alertmanager configuration
#alerting:
#  alertmanagers:
#    - static_configs:
#        - targets: ['10.10.170.161:9093']
          # - alertmanager:9093

# Load rules once and periodically evaluate them according to the global 'evaluation_interval'.
#rule_files:
#  - "node_down.yml"
  # - "first_rules.yml"
  # - "second_rules.yml"

# A scrape configuration containing exactly one endpoint to scrape:
# Here it's Prometheus itself.
scrape_configs:
  # The job name is added as a label `job=<job_name>` to any timeseries scraped from this config.
  - job_name: 'hyperledger-fabric'

    # metrics_path defaults to '/metrics'
    # scheme defaults to 'http'.

    static_configs:
      - targets: ['orderer0.example.com:8443' , 'orderer1.example.com:8444' , 'orderer2.example.com:8445' , 'peer0.org1.example.com:9443' , 'peer1.org1.example.com:9444' , 'peer0.org2.example.com:9443' , 'peer1.org2.example.com:9444']
编写 docker-compose-prometheus.yaml
version: '2.0'

services:

  prometheus:
    image: prom/prometheus:latest
    restart: always
    container_name: prometheus
    ports:
      - 9999:9090
    extra_hosts:
      - "orderer0.example.com:192.168.0.105"
      - "orderer1.example.com:192.168.0.105"
      - "orderer2.example.com:192.168.0.105"
      - "peer0.org1.example.com:192.168.0.109"
      - "peer1.org1.example.com:192.168.0.109"
      - "peer0.org2.example.com:192.168.0.110"
      - "peer1.org2.example.com:192.168.0.110"
    volumes:
      - ./prometheus.yml:/etc/prometheus/prometheus.yml

  grafana:
    image: grafana/grafana
    restart: always
    container_name: grafana
    ports:
      - 3000:3000
    depends_on:
      - prometheus
启动 prometheus :
docker-compose -f docker-compose-prometheus.yaml up -d
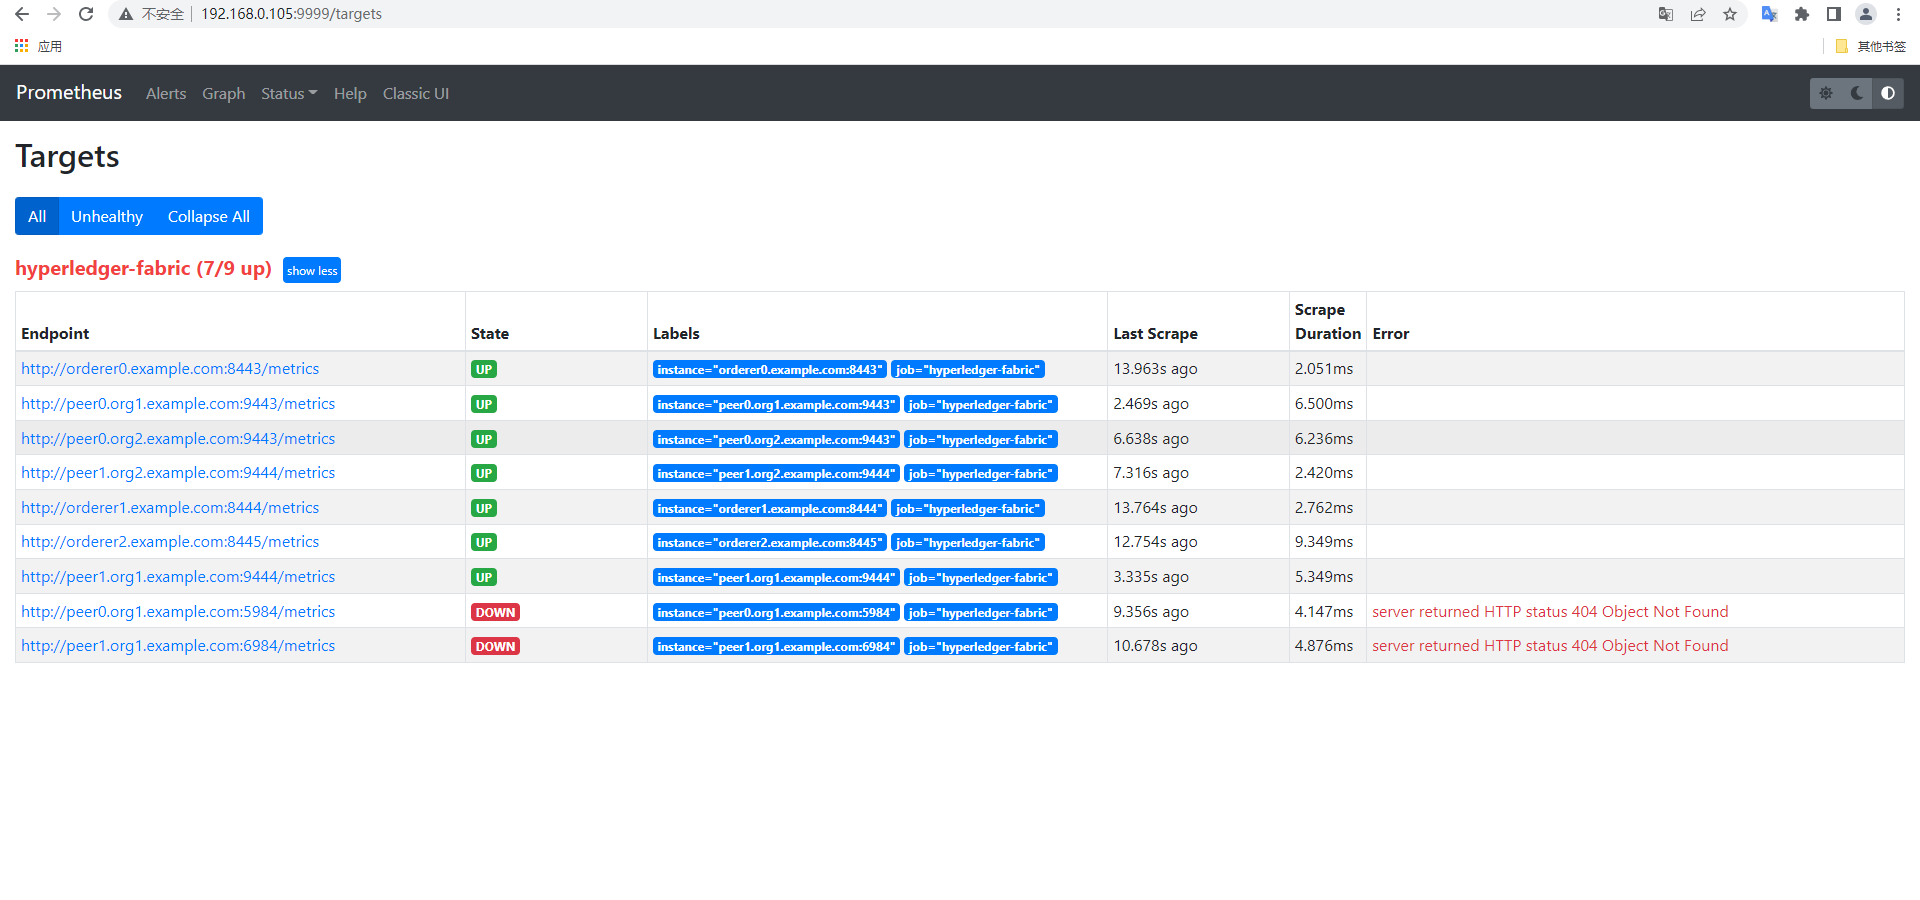
浏览器中访问:
http://192.168.0.105:9999/targets
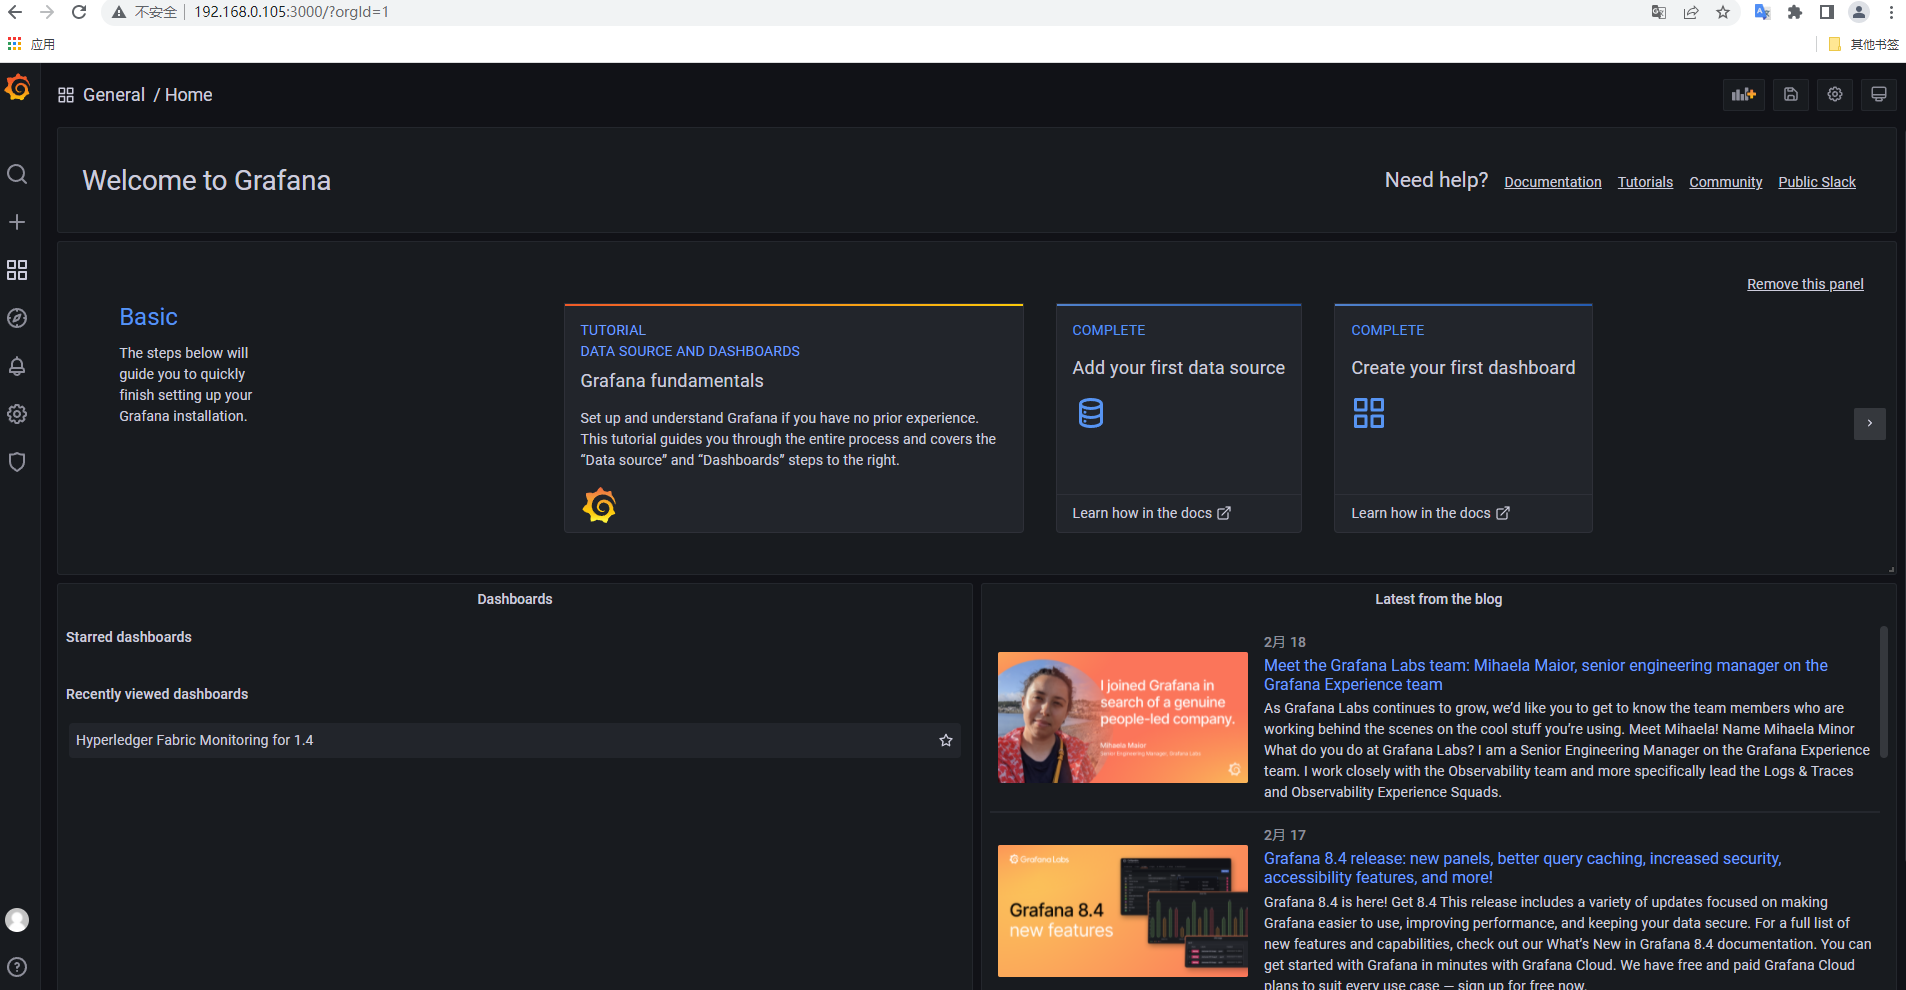
浏览器中访问: http://192.168.0.105:3000/ 打开 Grafana 界面
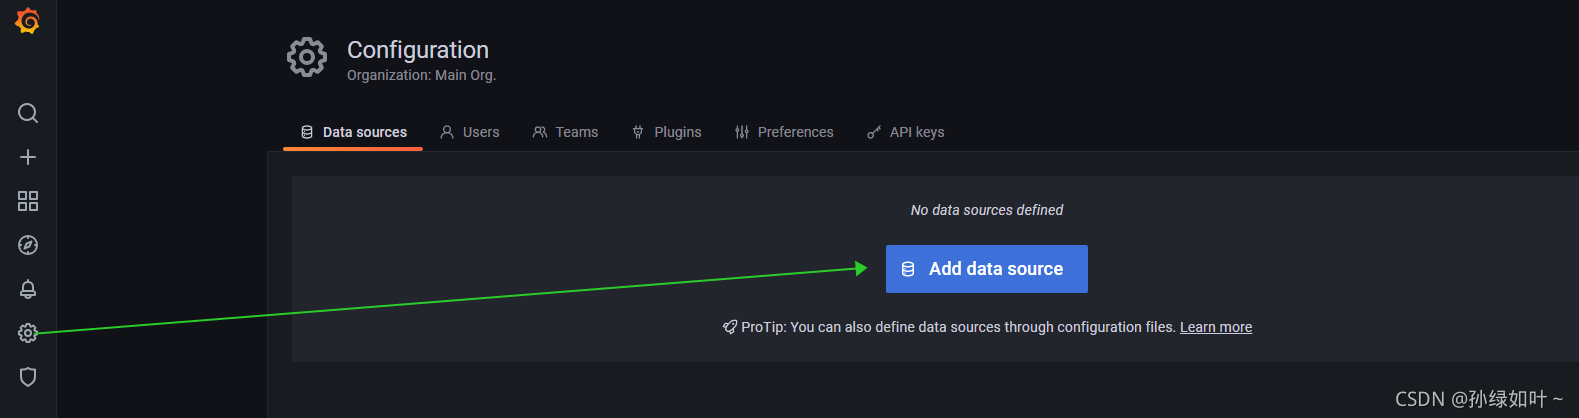
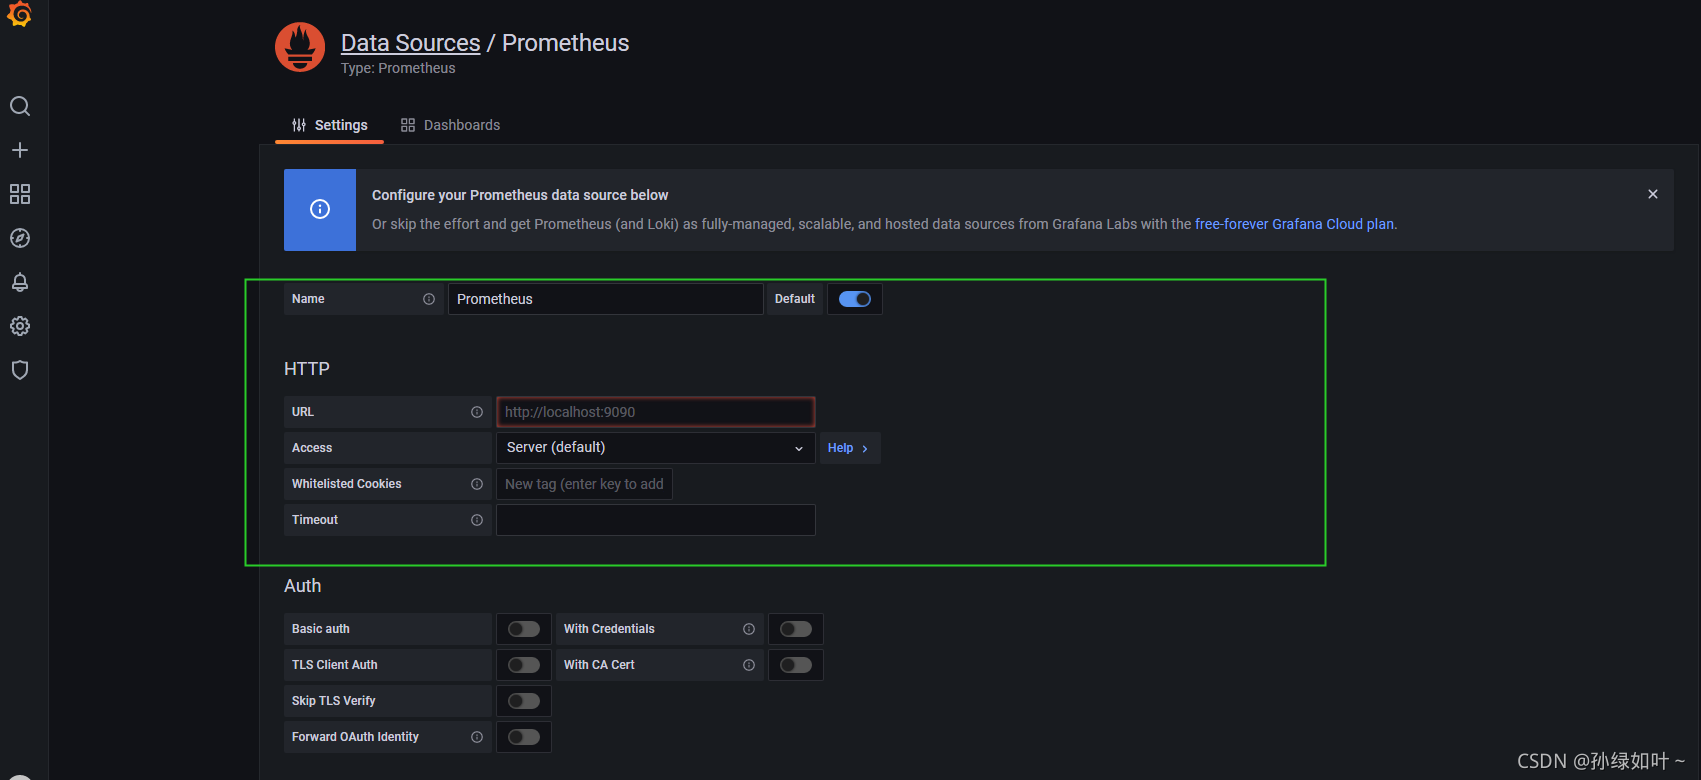
添加 prometheus 数据源:
配置 prometheus URL:
访问 https://grafana.com/grafana/dashboards/ 搜索需要监控组件的 dashboards 文件
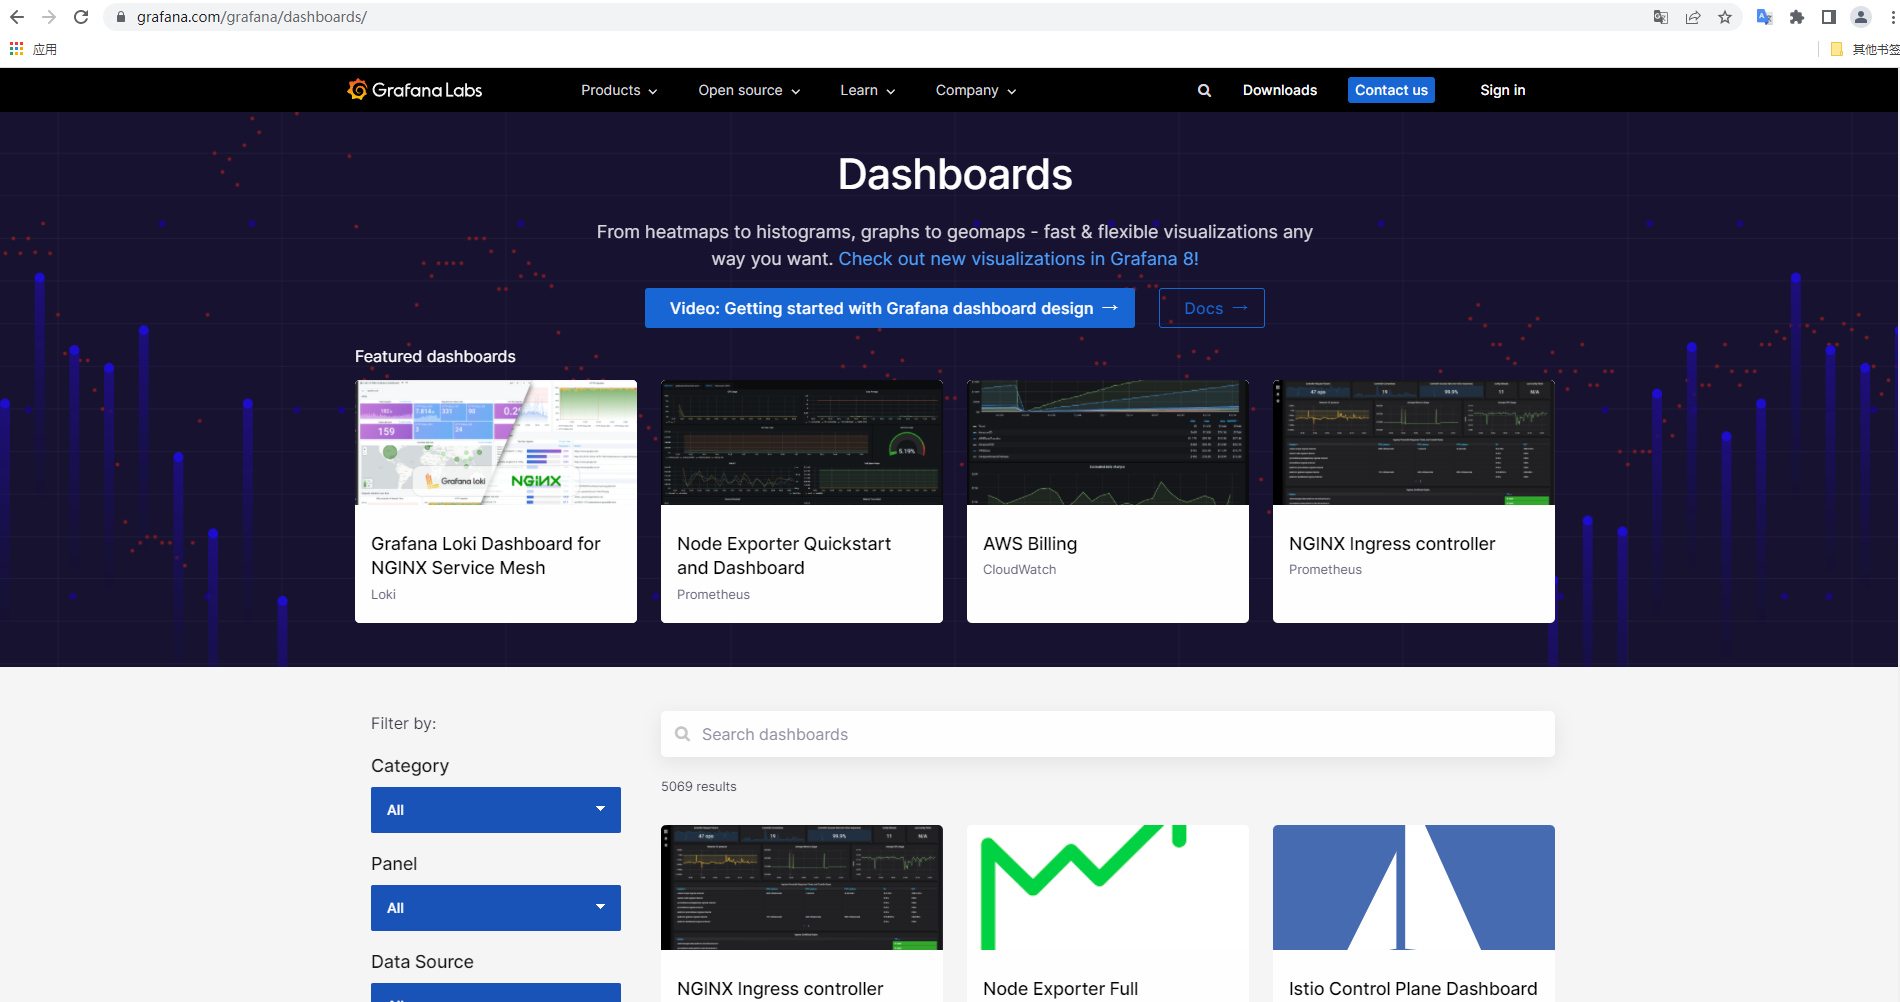
Hyperledger Fabric 监控目前只支持 1.4 版本。2.x 版本的应该之后会出。

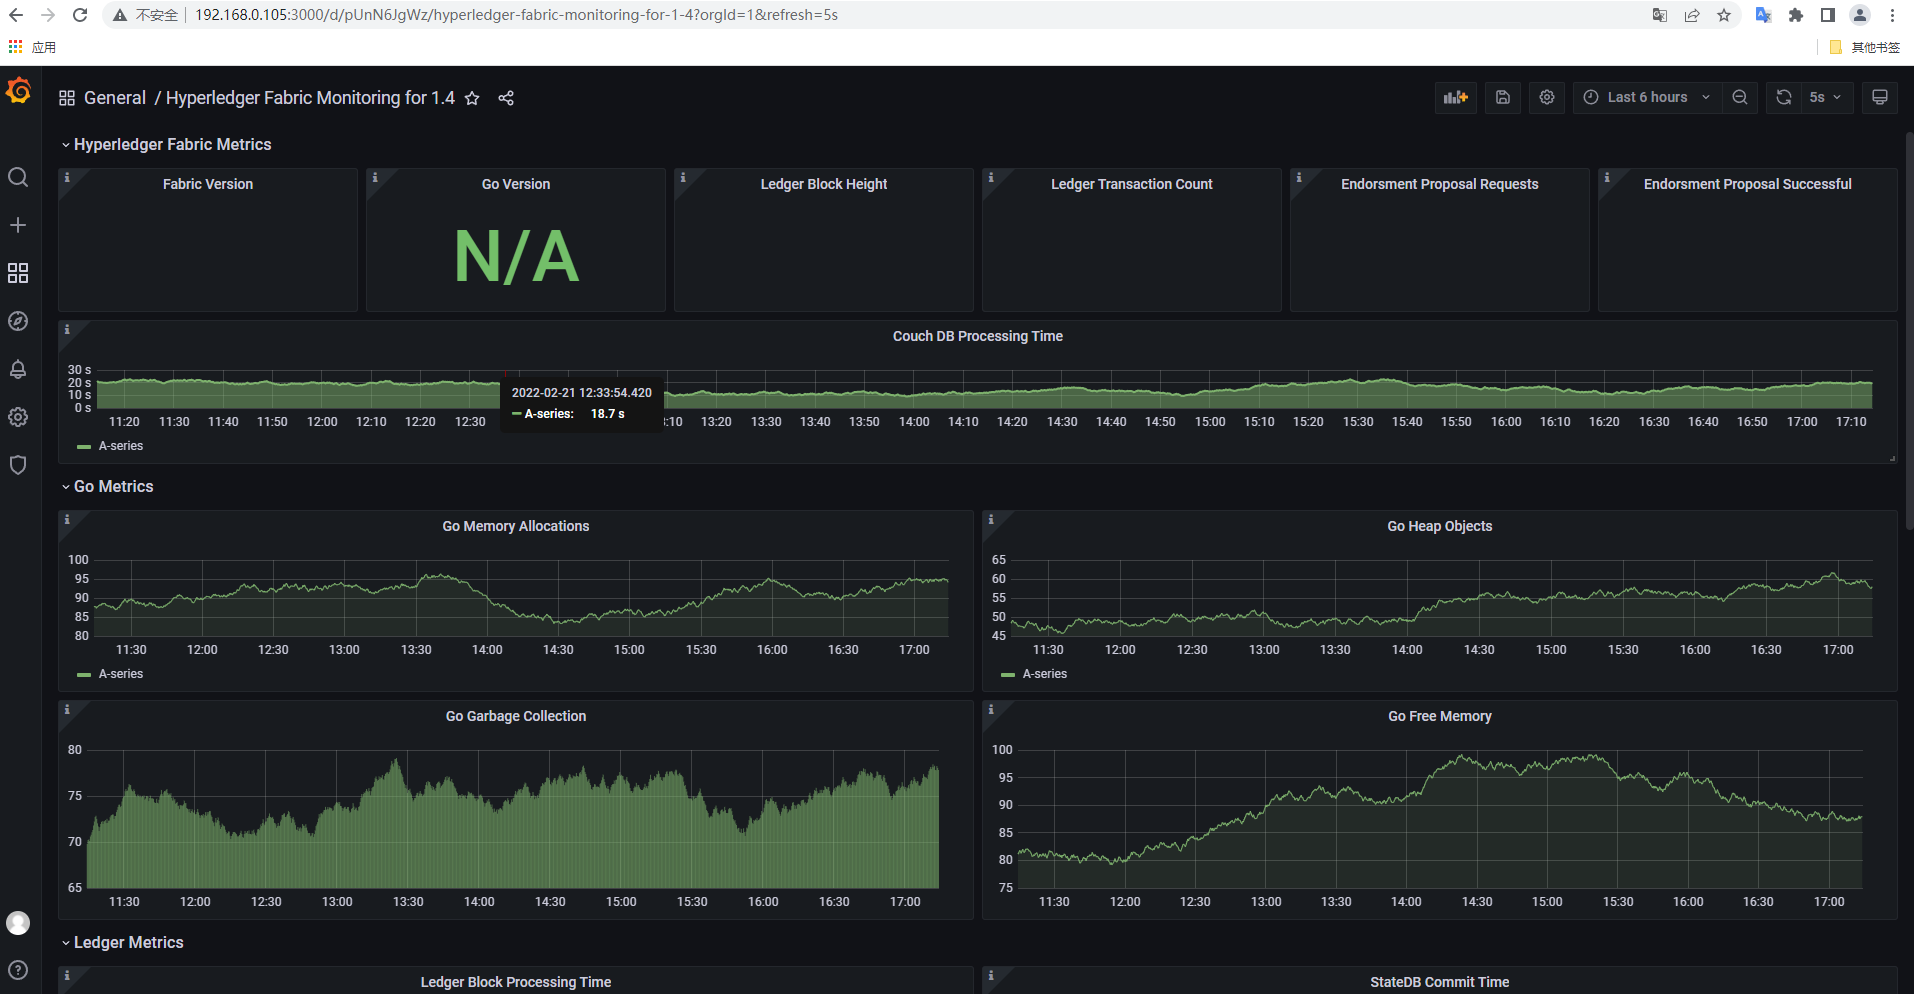
复制这个 dashboard id 添加 fabric dashboard:

效果如下:
grafanaymldocker composehyperledger fabricfabricprometheusdashboardsyaml
© 著作权归作者所有
举报

原文地址:https://blog.csdn.net/y19910825/article/details/135468967
本文来自互联网用户投稿,该文观点仅代表作者本人,不代表本站立场。本站仅提供信息存储空间服务,不拥有所有权,不承担相关法律责任。
如若转载,请注明出处:http://www.7code.cn/show_55568.html
如若内容造成侵权/违法违规/事实不符,请联系代码007邮箱:suwngjj01@126.com进行投诉反馈,一经查实,立即删除!
声明:本站所有文章,如无特殊说明或标注,均为本站原创发布。任何个人或组织,在未征得本站同意时,禁止复制、盗用、采集、发布本站内容到任何网站、书籍等各类媒体平台。如若本站内容侵犯了原著者的合法权益,可联系我们进行处理。


![[软件工具]文档页数统计工具软件pdf统计页数word统计页数ppt统计页数图文打印店快速报价工具](https://img-blog.csdnimg.cn/direct/09dfbaff3e9a47a9a551dd65fef5d482.jpeg)