一、K近邻算法
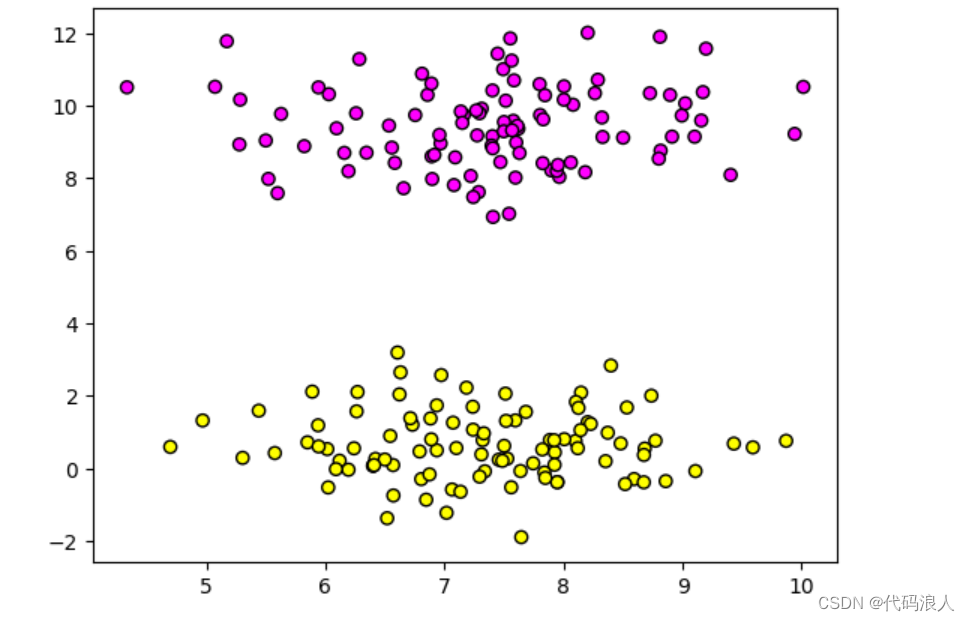
1.1 先画一个散列图
!pip install scikit-learn
-
make_blobs: 这是一个用于生成聚类数据的函数。它可以根据指定的参数生成一个具有多个簇的随机数据集。在这个例子中,make_blobs函数生成了一个包含200个样本、每个样本有2个特征、2个簇中心和簇标准差为1的随机数据集。
-
n_samples: 指定生成的样本数量。
-
n_features: 指定每个样本的特征数量。
-
centers: 指定生成的簇中心数量。
-
cluster_std: 指定每个簇的标准差。
-
random_state: 用于控制生成随机数据的随机种子,以确保生成的数据可重现。
-
X, y = data: 将生成的数据集分别赋值给X和y变量。X是样本特征矩阵,y是样本标签向量。
-
plt.scatter: 这是一个用于绘制散点图的函数。它可以根据指定的参数绘制带有颜色映射的散点图。
-
X[:, 0], X[:, 1]: 这是对特征矩阵X进行切片操作,选择第一列和第二列的所有行作为绘制散点图的横纵坐标。
-
c=y: 指定散点的颜色映射为y,即样本标签。
-
cmap=plt.cm.spring: 指定颜色映射为plt.cm.spring,即使用春季调色板来表示不同的标签。
-
edgecolors=‘k’: 指定散点的边框颜色为黑色。
-
plt.show(): 显示绘制的散点图。
from sklearn.datasets import make_blobs

from sklearn.neighbors import KNeighborsClassifier
import matplotlib.pyplot as plt

from sklearn.model_selection import train_test_split

# 生成随机的二维数据集
# 生成了一个包含200个样本、每个样本有2个特征、2个簇中心和簇标准差为1的随机数据集
data = make_blobs(n_samples=200, n_features=2, centers=2, cluster_std=1.0, random_state=8)
X, y = data

# 绘制散点图,根据y值设置颜色和映射关系
# 使用plt.cm.spring作为颜色映射,边框颜色为黑色
plt.scatter(X[:, 0], X[:, 1], c=y, cmap=plt.cm.spring, edgecolors='k')

plt.show()

1.2 使用K最近算法建模拟合数据
import numpy as np
from sklearn.datasets import make_blobs
from sklearn.neighbors import KNeighborsClassifier
import matplotlib.pyplot as plt

# 生成数据集
data = make_blobs(n_samples=200, n_features=2, centers=2, cluster_std=1.0, random_state=8)
X, y = data

# 创建KNN分类器
clf = KNeighborsClassifier()

# 使用数据X和标签y训练分类器
clf.fit(X, y)

# 用于画图的代码
x_min, x_max = X[:, 0].min() - 1, X[:, 0].max() + 1
y_min, y_max = X[:, 1].min() - 1, X[:, 1].max() + 1

# 创建网格点
xx, yy = np.meshgrid(np.arange(x_min, x_max, 0.02), np.arange(y_min, y_max, 0.02))

# 将网格点转换为一维数组,然后使用分类器进行预测
Z = clf.predict(np.c_[xx.ravel(), yy.ravel()])

# 将预测结果重塑为网格形状
Z = Z.reshape(xx.shape)

# 绘制彩色网格图
plt.pcolormesh(xx, yy, Z, cmap=plt.cm.spring)

# 绘制散点图
plt.scatter(X[:, 0], X[:, 1], c=y, cmap=plt.cm.spring, edgecolors='k')

# 设置x轴和y轴的范围
plt.xlim(xx.min(), xx.max())
plt.ylim(yy.min(), yy.max())

# 设置标题
plt.title("KNN")

# 显示图像
plt.show()

1.3 进行预测
# 进行判断预测
plt.scatter(6.75,4.82,marker='*',c='red',s=200)
# 显示图像
plt.show()

# 对新数据点分类进行判断
new_data = [[6.75, 4.82]]
print("新数据点的分类是",clf.predict(new_data))


1.4 K最近邻算法处理多元分类问题
这里可以把样本量修改成500个,数据类型也修改成5个
import matplotlib.pyplot as plt
import numpy as np
from sklearn.datasets import make_blobs

# 生成随机的二维数据集
# 生成了一个包含200个样本、每个样本有2个特征、2个簇中心和簇标准差为1的随机数据集
from sklearn.neighbors import KNeighborsClassifier

# 生成随机的二维数据集
# 生成了一个包含500个样本、每个样本有2个特征、5个簇中心和簇标准差为1的随机数据集
data = make_blobs(n_samples=500, n_features=2, centers=5, cluster_std=1.0, random_state=8)
X, y = data

# 绘制散点图,根据y值设置颜色和映射关系
# 使用plt.cm.spring作为颜色映射,边框颜色为黑色
plt.scatter(X[:, 0], X[:, 1], c=y, cmap=plt.cm.spring, edgecolors='k')

plt.show()

再次使用K最近算法进行建模
clf = KNeighborsClassifier()
# 使用数据X和标签y训练分类器
clf.fit(X, y)

# 用于画图的代码
x_min, x_max = X[:, 0].min() - 1, X[:, 0].max() + 1
y_min, y_max = X[:, 1].min() - 1, X[:, 1].max() + 1


# 创建网格点
xx, yy = np.meshgrid(np.arange(x_min, x_max, 0.02), np.arange(y_min, y_max, 0.02))

# 将网格点转换为一维数组,然后使用分类器进行预测
Z = clf.predict(np.c_[xx.ravel(), yy.ravel()])

# 将预测结果重塑为网格形状
Z = Z.reshape(xx.shape)

# 绘制彩色网格图
plt.pcolormesh(xx, yy, Z, cmap=plt.cm.spring)

# 绘制散点图
plt.scatter(X[:, 0], X[:, 1], c=y, cmap=plt.cm.spring, edgecolors='k')

# 设置x轴和y轴的范围
plt.xlim(xx.min(), xx.max())
plt.ylim(yy.min(), yy.max())

# 设置标题
plt.title("KNN")

# 显示图像
plt.show()

看一下正确率
print('模型的正确率{:.2f}',format(clf.score(X,y)))

1.5 K最近邻算法用于回归分析
import matplotlib.pyplot as plt
import numpy as np
from sklearn.datasets import make_regression

# 生成随机的二维数据集

# n_features 表示数据集的特征数
# n_informative 表示数据集中有多少个有意义的特征
# noise 表示噪声的大小
# random_state 表示随机数种子
X, y= make_regression(n_features=1, n_informative=1, noise=50, random_state=8)

# 绘制散点图
plt.scatter(X, y, c='orange', edgecolors='k')
plt.show()

进行分析
from sklearn.neighbors import KNeighborsClassifier
# 创建KNN分类器
# n_neighbors:用于确定KNN算法中邻居的数量
reg = KNeighborsClassifier(n_neighbors=5)
# 用于KNN模型进行拟合
reg.fit(X, y)
# 把预测结果绘制出来
z=np.linspace(-3,3,200).reshape(-1,1)
plt.scatter(X,y, c='orange', edgecolors='k')
plt.plot(z, reg.predict(z), c='k',linewidth=3)
# 向量图添加标题
plt.title('KNN')
plt.show()

进行评分
print('模型的正确率{:.2f}'.format(reg.score(X,y)))

可以调整,改变这一情况
# n_neighbors:用于确定KNN算法中邻居的数量
reg = KNeighborsRegressor(n_neighbors=2)

1.6 K最近邻算法项目实战-酒的分类
1.6.1 对数据进行分析
from sklearn.datasets import load_wine
wine_dataset = load_wine()
# 打印酒数据集中的键
print('打印酒数据集中的键')
print(wine_dataset.keys())
print("=============")
# 使用.shape属性查看数据的概况
print('查看数据的概况')
print(wine_dataset.data.shape)
print("=============")
print('查看数据集的描述')
print(wine_dataset.DESCR)
print("=============")

1.6.2 生成训练数据集和测试数据集
# 成训练数据集和测试数据集
from sklearn.model_selection import train_test_split
# random_state参数是用于控制数据集划分的随机性的参数。在使用train_test_split函数划分数据集时,可以通过设置random_state参数的值来确保每次运行代码时得到相同的训练集和测试集。
# random_state参数可以接受一个整数作为输入。当设置了random_state的值时,每次运行代码时都会得到相同的随机划分结果。这对于实验的可重复性和结果的稳定性非常重要。
# 如果不设置random_state参数,每次运行代码时都会得到不同的训练集和测试集划分结果。这在某些情况下可能是需要的,例如在对模型进行交叉验证或比较不同划分方式的性能时。
# 示例代码中的random_state=0表示设置随机种子为0,这样每次运行代码时都会得到相同的训练集和测试集划分结果。你可以根据需要选择合适的随机种子值,或者不设置random_state参数以获取不同的划分结果。
X_train, X_test, y_train, y_test = train_test_split(wine_dataset.data, wine_dataset.target, random_state=0)
#  使用.shape属性查看数据的概况
print(X_train.shape)
print(X_test.shape)
print(y_train.shape)
print(y_test.shape)
print("=============")

1.6.3 使用K最近邻算法对数据进行建模预测
# 导入K最近邻分类器模型
from sklearn.neighbors import KNeighborsClassifier

# 创建一个K值为1的K最近邻分类器
knn = KNeighborsClassifier(n_neighbors=1)

# 使用训练集对K最近邻分类器进行拟合
knn.fit(X_train, y_train)
print('查看准确率准确率')
print(knn.score(X_test, y_test))

1.6.4 对新数据进行分类
import numpy as np
X_new = np.array([[11.4, 1.7, 2.3, 15.6, 127, 0.9978, 3.36, 0.49, 8.5, 0.0,2,1,1]])
prediction = knn.predict(X_new)
print('查看对新数据的分类结果')
print(prediction)
print(wine_dataset['target_names'][prediction])1

二、广义线性模型
2.1线性模型的一般公式
画一个直线方程式y=0.5x+3
# 画一个直线方程式y=0.5x+3
import matplotlib.pyplot as plt
import numpy as np
# x在-5到5之间,元素数为100的等差数列
x = np.linspace(-5, 5, 100)# [[-5.0,-4.8989899,-4.7979798 ... 4.8989899   5.0]]
y = y=0.5*x+3  # 直线方程式y=0.5x+3

# 绘制直线
plt.plot(x, y,c='orange')

# 添加坐标轴标签和图标题
plt.xlabel('x')
plt.ylabel('y')
plt.title('y=0.5x+3')

通过两个点画一个直线
import numpy as np
import matplotlib.pyplot as plt
from sklearn.linear_model import LinearRegression

# 创建训练数据
X = [[1], [4]]  # 自变量,即x的取值
y = [3, 5]  # 因变量,即对应的y值

# 创建并拟合线性回归模型
model = LinearRegression()
model.fit(X, y)

# 创建用于绘制直线的自变量范围
z = np.linspace(0, 5, 20)  # 在0到5之间生成20个点

# 绘制散点图
plt.scatter(X, y, s=80, c='red')

# 绘制拟合的直线
plt.plot(z, model.predict(z.reshape(-1, 1)), c='green')

# 设置标题和图例
plt.title('Straight Line')

# 显示图形
plt.show()

# 所得他们的直线方程式y=0.667x+2.333
print('y={:3f}'.format(model.coef_[0]),'x','+ {:3f}'.format(model.intercept_))

2.2 通过数据集绘制
import numpy as np
from matplotlib import pyplot as plt
from sklearn.linear_model import LinearRegression
X=[[1],[4],[3]]
y=[3,5,3]
model=LinearRegression().fit(X,y)

z=np.linspace(0,5,20)

plt.scatter(X,y,s=80,c='red')

plt.plot(z,model.predict(z.reshape(-1,1)),c='green')

plt.title('Straight Line')
plt.show()

# 所得他们的直线方程式y=0.667x+2.333
print('y={:3f}'.format(model.coef_[0]),'x','+ {:3f}'.format(model.intercept_))

import numpy as np
from matplotlib import pyplot as plt
from sklearn.datasets import make_regression
from sklearn.linear_model import LinearRegression

X, y = make_regression(n_samples=50, n_features=1, n_informative=1, noise=50, random_state=1)


model=LinearRegression().fit(X,y)

z=np.linspace(-3,3,200)

plt.scatter(X,y,s=80,c='red')

plt.plot(z,model.predict(z.reshape(-1,1)),c='green')

plt.title('Straight Line')
plt.show()

# 所得他们的直线方程式y=0.667x+2.333
print('y={:3f}'.format(model.coef_[0]),'x','+ {:3f}'.format(model.intercept_))

2.2.1 查看系数和截距
# 查看系数和截距
print('系数:',model.coef_[0])
print('截距:',model.intercept_)

2.3 最基本的线性模型-回归
n_features和n_informative都是用于控制生成回归数据集的参数。
-
n_features表示生成数据集时自变量的数量。在回归分析中,自变量是影响因变量的变量。通过指定n_features的值,可以控制生成数据集时自变量的数量。
-
n_informative表示在生成数据集时有用的自变量的数量。在回归分析中,有用的自变量是真正与因变量相关的变量。通过指定n_informative的值,可以控制生成数据集时有用的自变量的数量。
举个例子:
如果n_features=5,n_informative=3,则生成的数据集中会有5个自变量,其中有3个是与因变量相关的有用自变量,而另外2个则是与因变量不相关的无用自变量。
通过调整这两个参数的值,可以模拟不同的实际情况,用于测试和验证回归模型的性能。
from sklearn.datasets import make_regression
from sklearn.linear_model import LinearRegression
from sklearn.model_selection import train_test_split

X, y = make_regression(n_samples=100, n_features=2, n_informative=2, random_state=38)
X_train, X_test, y_train, y_test = train_test_split(X, y, random_state=8)


lr=LinearRegression().fit(X_train,y_train)


print('系数:',lr.coef_[:])
print('截距:',lr.intercept_)

# 这里的回归模型的方程可以表示为
print('y=',lr.coef_[0],'X1+',lr.coef_[1],'X2',lr.intercept_)

print('查看训练准确率准确率')
print(lr.score(X_train, y_train))
print('查看测试准确率准确率')
print(lr.score(X_test, y_test))

实战:糖尿病
正式的数据中会出现很多的noise,所以,可能并不准确
from sklearn.datasets import load_diabetes
from sklearn.linear_model import LinearRegression
from sklearn.model_selection import train_test_split

X, y = load_diabetes().data, load_diabetes().target
X_train, X_test, y_train, y_test = train_test_split(X, y, random_state=8)


lr=LinearRegression().fit(X_train,y_train)


print('系数:',lr.coef_[:])
print('截距:',lr.intercept_)

# 这里的回归模型的方程可以表示为
print('y=',lr.coef_[0],'X1+',lr.coef_[1],'X2',lr.intercept_)

print('查看训练准确率准确率')
print(lr.score(X_train, y_train))
print('查看测试准确率准确率')
print(lr.score(X_test, y_test))

2.4 使用L2正则化的线性模型-岭回归
2.4.1 岭回归的原理
是一种避免过拟合的方法,会保留全部的特征变量,但是会减少特征变量的系数值,通过alpha改变。
这种方法我么们称之为L2正则化
from sklearn.datasets import load_diabetes
from sklearn.linear_model import Ridge
from sklearn.model_selection import train_test_split

X, y = load_diabetes().data, load_diabetes().target
X_train, X_test, y_train, y_test = train_test_split(X, y, random_state=8)

ridge=Ridge().fit(X_train, y_train)


print('系数:',ridge.coef_[:])
print('截距:',ridge.intercept_)


print('查看训练准确率准确率')
print(ridge.score(X_train, y_train))
print('查看测试准确率准确率')
print(ridge.score(X_test, y_test))

如果注重模型的泛化能力,就是用岭回归模型
这里alpha默认是1
通过修改alpha的值可以改变得分
from sklearn.datasets import load_diabetes
from sklearn.linear_model import Ridge
from sklearn.model_selection import train_test_split

X, y = load_diabetes().data, load_diabetes().target
X_train, X_test, y_train, y_test = train_test_split(X, y, random_state=8)

ridge=Ridge(alpha=0.001).fit(X_train, y_train)


print('系数:',ridge.coef_[:])
print('截距:',ridge.intercept_)


print('查看训练准确率准确率')
print(ridge.score(X_train, y_train))
print('查看测试准确率准确率')
print(ridge.score(X_test, y_test))

等于10的时候

2.5 使用L1正则化的线性模型-套索回归
就是在L2的基础上,有些系数置为0
- alpha=10
- max_iter=10000最大迭代次数
from sklearn.datasets import load_diabetes
from sklearn.linear_model import Lasso
from sklearn.model_selection import train_test_split

X, y = load_diabetes().data, load_diabetes().target
X_train, X_test, y_train, y_test = train_test_split(X, y, random_state=8)

lasso=Lasso(alpha=10, max_iter=10000).fit(X_train, y_train)


print('系数:',lasso.coef_[:])
print('截距:',lasso.intercept_)


print('查看训练准确率准确率')
print(lasso.score(X_train, y_train))
print('查看测试准确率准确率')
print(lasso.score(X_test, y_test))

三、朴素贝叶斯基本概念
- 贝努力朴素贝叶斯(Bernoulli Naive Bayes):
- 适用于二元特征数据(每个特征只有两种取值,如存在与否、真假等)。
- 基于贝努利分布模型,假设特征之间相互独立。
- 计算每个类别对应特征的条件概率以及类别的先验概率,然后使用贝叶斯定理计算后验概率,从而进行分类。
- 高斯贝叶斯(Gaussian Naive Bayes):
- 适用于连续型特征数据,假设特征符合
高斯分布(正态分布)。 - 基于连续型特征的数值计算特征的均值和方差,然后使用高斯概率密度函数计算概率。
- 计算每个类别对应特征的条件概率以及类别的先验概率,然后使用贝叶斯定理计算后验概率,从而进行分类。
- 多项式朴素贝叶斯(Multinomial Naive Bayes):
- 适用于离散型特征数据,通常用于
文本分类问题。 - 基于多项分布模型,假设特征的取值是离散型且是用计数表示的。
- 计算每个类别对应特征的条件概率以及类别的先验概率,然后使用贝叶斯定理计算后验概率,从而进行分类。
3.1 贝努力朴素贝叶斯(二项式分布|0-1分布)
import numpy as np

X= np.array([[0,1,0,1],
             [1,1,1,0],
             [0,1,1,0],
             [0,0,0,1],
             [0,1,1,0],
             [0,1,0,1],
             [1,0,0,1]])
y= np.array([0,1,1,0,1,0,0])

counts={}
for label in np.unique(y):
    print(X[y==label])
    counts[label]=X[y==label].sum(axis=0)
print(counts)
# 导入贝努力贝叶斯
from sklearn.naive_bayes import BernoulliNB
# 使用贝努力贝叶斯拟合数据
clf=BernoulliNB()
clf.fit(X,y)
# 要进行预测的这一天,没有刮风,也不闷热
Next_day=[[0,0,1,0]]
print("nn")
pre=clf.predict(Next_day)
# 代码运行结果
if pre==[1]:
    print("下雨了")
else:
    print("不下雨")


Another_day=[[1,1,0,1]]
pre2=clf.predict(Another_day)
# 代码运行结果
if pre2==[1]:
    print("下雨了")
else:
    print("不下雨")

# 查看准确率的概率clf.predict_proba(数据)
print(clf.predict_proba(Next_day))
# 》》》[[0.13848881 0.86151119]] 下雨的概率为0.86151119,不下雨的概率为0.13848881
[[0 1 0 1]
 [0 0 0 1]
 [0 1 0 1]
 [1 0 0 1]]
[[1 1 1 0]
 [0 1 1 0]
 [0 1 1 0]]
{0: array([1, 2, 0, 4]), 1: array([1, 3, 3, 0])}


下雨了
不下雨
[[0.13848881 0.86151119]]

Process finished with exit code 0
但是用于更复杂的就不行了
"""
@FileName:016-P.py
@Description:
@Author:lucky
@Time:2024/1/16 21:34
"""
from sklearn.datasets import make_blobs
from sklearn.naive_bayes import BernoulliNB
from sklearn.model_selection import train_test_split

# 生成随机数据集
X, y = make_blobs(n_samples=500, centers=5, random_state=8)

# 分割数据集为训练集和测试集
X_train, X_test, y_train, y_test = train_test_split(X, y,  random_state=8)

# 使用贝努力朴素贝叶斯算法进行分类
model = BernoulliNB()
model.fit(X_train, y_train)

# 计算模型得分
score = model.score(X_test, y_test)
print("模型得分:", score)
模型得分: 0.544
3.1.1 工作原理
import numpy as np
import matplotlib.pyplot as plt
from sklearn.datasets import make_blobs
from sklearn.naive_bayes import BernoulliNB
from sklearn.model_selection import train_test_split

# 生成随机数据集
X, y = make_blobs(n_samples=500, centers=5, random_state=8)

# 分割数据集为训练集和测试集
X_train, X_test, y_train, y_test = train_test_split(X, y, random_state=8)

# 使用贝努力朴素贝叶斯算法进行分类
model = BernoulliNB()
model.fit(X_train, y_train)

# 可视化决策边界
x_min, x_max = X[:, 0].min() - 1, X[:, 0].max() + 1   # 设置 x 轴范围
y_min, y_max = X[:, 1].min() - 1, X[:, 1].max() + 1   # 设置 y 轴范围
xx, yy = np.meshgrid(np.arange(x_min, x_max, 0.02),   # 生成网格点
                     np.arange(y_min, y_max, 0.02))
Z = model.predict(np.c_[xx.ravel(), yy.ravel()])     # 预测网格点类别
Z = Z.reshape(xx.shape)                              # 将预测结果转换为网格矩阵
plt.contourf(xx, yy, Z, cmap=plt.cm.Paired, alpha=0.8) # 绘制决策区域
plt.scatter(X[:, 0], X[:, 1], c=y, cmap=plt.cm.Paired) # 绘制样本散点图
plt.title('Bernoulli Naive Bayes')                    # 设置标题
plt.xlabel('Feature 1')                                # 设置 x 轴标签
plt.ylabel('Feature 2')                                # 设置 y 轴标签
plt.show()                                             # 显示图像

分为两类
特征一大于等于0 且特征二大于等于0 分为一类
特征一小于0 且特征二小于0 分为一类
3.2 高斯朴素贝叶斯
"""
@FileName:016-P.py
@Description:
@Author:lucky
@Time:2024/1/16 21:34
"""
from sklearn.datasets import make_blobs
from sklearn.naive_bayes import BernoulliNB, GaussianNB
from sklearn.model_selection import train_test_split

# 生成随机数据集
X, y = make_blobs(n_samples=500, centers=5, random_state=8)

# 分割数据集为训练集和测试集
X_train, X_test, y_train, y_test = train_test_split(X, y,  random_state=8)

# 使用高斯朴素贝叶斯算法进行分类
model = GaussianNB()
model.fit(X_train, y_train)

# 计算模型得分
score = model.score(X_test, y_test)
print("模型得分:", score)

import numpy as np
import matplotlib.pyplot as plt
from sklearn.datasets import make_blobs
from sklearn.naive_bayes import BernoulliNB, GaussianNB
from sklearn.model_selection import train_test_split

# 生成随机数据集
X, y = make_blobs(n_samples=500, centers=5, random_state=8)

# 分割数据集为训练集和测试集
X_train, X_test, y_train, y_test = train_test_split(X, y, random_state=8)

# 使用高斯朴素贝叶斯算法进行分类
model = GaussianNB()
model.fit(X_train, y_train)

# 可视化决策边界
x_min, x_max = X[:, 0].min() - 1, X[:, 0].max() + 1   # 设置 x 轴范围
y_min, y_max = X[:, 1].min() - 1, X[:, 1].max() + 1   # 设置 y 轴范围
xx, yy = np.meshgrid(np.arange(x_min, x_max, 0.02),   # 生成网格点
                     np.arange(y_min, y_max, 0.02))
Z = model.predict(np.c_[xx.ravel(), yy.ravel()])     # 预测网格点类别
Z = Z.reshape(xx.shape)                              # 将预测结果转换为网格矩阵
plt.contourf(xx, yy, Z, cmap=plt.cm.Paired, alpha=0.8) # 绘制决策区域
plt.scatter(X[:, 0], X[:, 1], c=y, cmap=plt.cm.Paired) # 绘制样本散点图
plt.title('Gaussian Naive Bayes')                    # 设置标题
plt.xlabel('Feature 1')                                # 设置 x 轴标签
plt.ylabel('Feature 2')                                # 设置 y 轴标签
plt.show()                                             # 显示图像
                                         # 显示图像

3.2.1 实战
"""
@FileName:020-P.py
@Description:
@Author:lucky
@Time:2024/1/16 21:56
"""
import numpy as np
import pandas as pd
from sklearn.datasets import load_breast_cancer
from sklearn.model_selection import train_test_split
from sklearn.naive_bayes import GaussianNB
from sklearn.metrics import accuracy_score

# 加载肿瘤数据集
data = load_breast_cancer()
X, y = data.data, data.target

# 查看数据集的键值
print(data.keys())

# 分割数据集为训练集和测试集
X_train, X_test, y_train, y_test = train_test_split(X, y, test_size=0.2, random_state=8)

# 查看训练集和测试集的特征
print("训练集特征形状:", X_train.shape)
print("测试集特征形状:", X_test.shape)

# 使用高斯朴素贝叶斯算法进行分类
model = GaussianNB()
model.fit(X_train, y_train)

# 在测试集上进行预测
y_pred = model.predict(X_test)

# 查看模型在测试集上的准确率
accuracy = accuracy_score(y_test, y_pred)
print("模型在测试集上的准确率:", accuracy)


# 对单个样本进行预测

pred = model.predict([X[312]])
print("对单个样本进行预测,预测分类结果:", pred)
print("实际分类结果:", y[312])
dict_keys(['data', 'target', 'frame', 'target_names', 'DESCR', 'feature_names', 'filename', 'data_module'])
训练集特征形状: (455, 30)
测试集特征形状: (114, 30)
模型在测试集上的准确率: 0.9473684210526315
对单个样本进行预测,预测分类结果: [1]
实际分类结果: 1

Process finished with exit code 0
"""
@FileName:021-P.py
@Description:
@Author:lucky
@Time:2024/1/16 22:03
"""
import numpy as np
import matplotlib.pyplot as plt
from sklearn.datasets import load_breast_cancer
from sklearn.model_selection import learning_curve
from sklearn.naive_bayes import GaussianNB

# 加载肿瘤数据集
data = load_breast_cancer()
X, y = data.data, data.target

# 定义高斯朴素贝叶斯模型
model = GaussianNB()

# 生成学习曲线数据
train_sizes, train_scores, valid_scores = learning_curve(model, X, y, train_sizes=[0.1, 0.3, 0.5, 0.7, 0.9], cv=5)

# 计算平均值和标准差
train_mean = np.mean(train_scores, axis=1)
train_std = np.std(train_scores, axis=1)
valid_mean = np.mean(valid_scores, axis=1)
valid_std = np.std(valid_scores, axis=1)

# 绘制学习曲线
plt.figure(figsize=(8, 6))
plt.plot(train_sizes, train_mean, 'o-', color="r", label="Training score")
plt.plot(train_sizes, valid_mean, 'o-', color="g", label="Cross-validation score")
plt.fill_between(train_sizes, train_mean - train_std, train_mean + train_std, alpha=0.1, color="r")
plt.fill_between(train_sizes, valid_mean - valid_std, valid_mean + valid_std, alpha=0.1, color="g")
plt.xlabel("Training examples")
plt.ylabel("Score")
plt.legend(loc="best")
plt.grid(True)
plt.title("Learning Curve")
plt.show()

Cross-validation score是交叉验证得分的意思。在机器学习中,我们经常使用交叉验证来评估模型的性能。交叉验证是一种将数据集划分为训练集和验证集的方法,用于模型的训练和评估。
具体来说,交叉验证将数据集分成k个相等大小的子集,其中k-1个子集被用作训练集,剩下的一个子集被用作验证集。然后,用这k个子集进行k次训练和验证,每次都选择一个不同的子集作为验证集。最后,将这k次验证得分取平均值作为模型的性能指标,就是交叉验证得分。
交叉验证得分代表了模型在不同训练集和验证集上的平均性能。它可以帮助我们评估模型的泛化能力,即模型在未见过的数据上的表现。较高的交叉验证得分表示模型具有更好的泛化能力,因为它在多个不同的训练集和验证集上都表现良好。
在验证曲线中,交叉验证得分是横坐标参数取值对应的纵坐标值,可以通过观察交叉验证得分的变化来选择最优的参数值。
四、决策树与随机森林
4.1 决策树
决策树是一种用于分类和回归问题的机器学习算法。它使用树状结构来表示决策规则,并根据特征的取值进行分支,直到达到最终的预测结果。下面是决策树的基本原理,并附有一个简单的图解。
决策树的基本原理如下:
-
特征选择:在每个节点上,决策树通过选择最优的特征来进行分裂。最优的特征是那个能够将样本划分得最清晰的特征,即使得不同类别的样本尽可能地分开。
-
分裂节点:根据选择的最优特征,将当前节点的样本分为不同的子集。每个子集对应一个分支,根据特征取值的不同,样本会被分配到不同的子节点上。
-
递归分割:对于每个子节点,重复上述过程,选择最优特征进行分裂,直到达到停止条件。停止条件可以是达到
最大深度、样本数量小于阈值或者节点中的样本都属于相同类别。 -
预测结果:当达到停止条件时,叶子节点中的样本将被赋予相应的预测结果,通常是该叶子节点中样本数量最多的类别。

4.1.1 实战
import matplotlib.pyplot as plt
import numpy as np
from sklearn.datasets import load_wine
from sklearn.model_selection import train_test_split
from sklearn.tree import DecisionTreeClassifier
from sklearn.tree import plot_tree

# 加载酒数据集
wine = load_wine()

# 只选择前两个特征作为X
X = wine.data[:, :2]

# 酒的目标分类作为y
y = wine.target

# 划分训练集和测试集
X_train, X_test, y_train, y_test = train_test_split(X, y)

# 初始化决策树分类器
tree = DecisionTreeClassifier(max_depth=1)
tree.fit(X_train, y_train)
# 定义图像中区分颜色和散点的颜色
colors = ['r', 'g', 'b']

# 分别用两个特征值构建图像的横轴和纵轴
x_min, x_max = X[:, 0].min() - 1, X[:, 0].max() + 1
y_min, y_max = X[:, 1].min() - 1, X[:, 1].max() + 1

xx, yy = np.meshgrid(np.arange(x_min, x_max, .02),
                     np.arange(y_min, y_max, .02))
Z = tree.predict(np.c_[xx.ravel(), yy.ravel()])
Z = Z.reshape(xx.shape)
# 给每个分类的样本配不同的颜色
plt.figure()  # 设置画布大小
plt.contourf(xx, yy, Z, alpha=.4, cmap='viridis')
plt.scatter(X_train[:, 0], X_train[:, 1], c=y_train, s=20, cmap='viridis', edgecolors='k')
plt.xlim(xx.min(), xx.max())
plt.ylim(yy.min(), yy.max())
plt.title("Decision Tree")
plt.show()

深度为1的时候显然不太好
深度改为3,明显有了改善

深度改成5
import matplotlib.pyplot as plt
import numpy as np
from sklearn.datasets import load_wine
from sklearn.model_selection import train_test_split
from sklearn.tree import DecisionTreeClassifier
from sklearn.tree import plot_tree

# 加载酒数据集
wine = load_wine()

# 只选择前两个特征作为X
X = wine.data[:, :2]

# 酒的目标分类作为y
y = wine.target

# 划分训练集和测试集
X_train, X_test, y_train, y_test = train_test_split(X, y)

# 初始化决策树分类器
tree = DecisionTreeClassifier(max_depth=5)
tree.fit(X_train, y_train)

# 定义图像中区分颜色和散点的颜色
colors = ['r', 'g', 'b']

# 分别用两个特征值构建图像的横轴和纵轴
x_min, x_max = X[:, 0].min() - 1, X[:, 0].max() + 1
y_min, y_max = X[:, 1].min() - 1, X[:, 1].max() + 1

xx, yy = np.meshgrid(np.arange(x_min, x_max, .02),
                     np.arange(y_min, y_max, .02))
Z = tree.predict(np.c_[xx.ravel(), yy.ravel()])
Z = Z.reshape(xx.shape)

# 给每个分类的样本配不同的颜色
plt.figure(figsize=(8, 6))  # 设置画布大小
plt.contourf(xx, yy, Z, alpha=.4, cmap='viridis')
for i, color in zip(range(len(wine.target_names)), colors):
    idx = np.where(y_train == i)
    plt.scatter(X_train[idx, 0], X_train[idx, 1], c=color, label=wine.target_names[i],
                cmap=plt.cm.Set1, edgecolor='k')
plt.xlim(xx.min(), xx.max())
plt.ylim(yy.min(), yy.max())
plt.title("Wine Dataset - Decision Tree")
plt.legend()
plt.show()

4.2 随机森林
import graphviz
import matplotlib.pyplot as plt
import numpy as np
from sklearn.datasets import load_wine
from sklearn.ensemble import RandomForestClassifier
from sklearn.model_selection import train_test_split
from sklearn.tree import DecisionTreeClassifier
from sklearn.tree import export_graphviz

# 加载酒数据集
wine = load_wine()

# 只选择前两个特征作为X
X = wine.data[:, :2]

# 酒的目标分类作为y
y = wine.target

# 划分训练集和测试集
X_train, X_test, y_train, y_test = train_test_split(X, y)

# 设定随机森林中有6棵决策树
forest = RandomForestClassifier(n_estimators=6)
forest.fit(X_train, y_train)

# 定义三个分类的颜色
colors = ['r', 'g', 'b']

# 分别用两个特征值构建图像的横轴和纵轴
x_min, x_max = X[:, 0].min() - 1, X[:, 0].max() + 1
y_min, y_max = X[:, 1].min() - 1, X[:, 1].max() + 1

# 生成网格点坐标矩阵
xx, yy = np.meshgrid(np.arange(x_min, x_max, .02),
                     np.arange(y_min, y_max, .02))

# 对网格点进行预测
Z = forest.predict(np.c_[xx.ravel(), yy.ravel()])
Z = Z.reshape(xx.shape)

# 绘制分类边界和训练集、测试集的散点图
plt.figure()
plt.pcolormesh(xx, yy, Z, cmap=plt.cm.spring)  # 绘制分类区域
plt.scatter(X_train[:, 0], X_train[:, 1], c=[colors[i] for i in y_train])  # 绘制训练集散点图
plt.scatter(X_test[:, 0], X_test[:, 1], c=[colors[i] for i in y_test])  # 绘制测试集散点图
plt.show()  # 显示图形

max_features 参数在随机森林中起到了控制特征选择的作用。下面我将举一个例子来说明 max_features 参数的影响。
假设我们有一个数据集,包含 1000 个样本和 10 个特征。我们使用随机森林进行分类任务,并设置 max_features 参数为不同的取值,比如 2、5 和 10。
-
当 max_features=2 时,每个决策树在构建节点时只会从 10 个特征中随机选择 2 个特征进行考虑。这种情况下,模型的泛化能力可能会较好,因为每个决策树在节点划分时只考虑了少量特征,减少了特征之间的冗余性。但是,由于只考虑了部分特征,可能会导致模型失去一些重要特征的信息,从而导致模型的性能下降。
-
当 max_features=5 时,每个决策树在构建节点时会从 10 个特征中随机选择 5 个特征进行考虑。这种情况下,模型可能会更好地利用特征之间的关联性,因为每个决策树考虑了更多的特征。相比于 max_features=2,模型的性能可能会有所提升,但同时也增加了建树的时间和空间消耗。
-
当 max_features=10 时,每个决策树在构建节点时会考虑所有的特征。这种情况下,模型可以充分利用所有的特征信息,但是可能会增加特征之间的冗余性,导致模型过拟合。
总而言之,max_features 参数的取值越小,模型越倾向于选择少量的特征,减少特征之间的冗余性,从而提高模型的泛化能力。而当 max_features 参数取值增加时,模型更倾向于利用更多的特征信息,这可能会提高模型的拟合能力,但也可能增加过拟合的风险。因此,在实际应用中,我们通常需要通过交叉验证等方法来选择合适的 max_features 参数取值,以达到最佳的模型性能。
max_features 取得越高越像,每个树越像
当 max_features=2 时,每棵决策树在构建节点时会从特征集中随机选择 2 个特征进行考虑。这意味着每棵决策树都会使用相同的 2 个特征来进行节点划分。具体的树的数量取决于随机森林算法的参数设置。
随机森林是由多棵决策树组成的集成学习模型。一般情况下,我们可以通过设置超参数 n_estimators 来控制随机森林中树的数量。例如,如果设置 n_estimators=100,则随机森林会包含 100 棵决策树。
每棵树都是独立地使用随机特征子集进行构建的,所以每棵树的特征选择可能是不同的。但是由于 max_features 参数的限制,每棵树都只会从特征集中随机选择 2 个特征进行考虑。
因此,当 max_features=2 且 n_estimators=100 时,随机森林会包含 100 棵决策树,每棵决策树都使用相同的 2 个特征进行构建。这样的设置有助于减少特征的冗余性,并提高模型的泛化能力。
五、支持向量机SVM
- 多项式内核
- 径向基内核(RBF)
多项式内核:
它是通过把样本原始特征进行乘方把数据投射到高维空间
5.1 支持向量机SVM的核函数
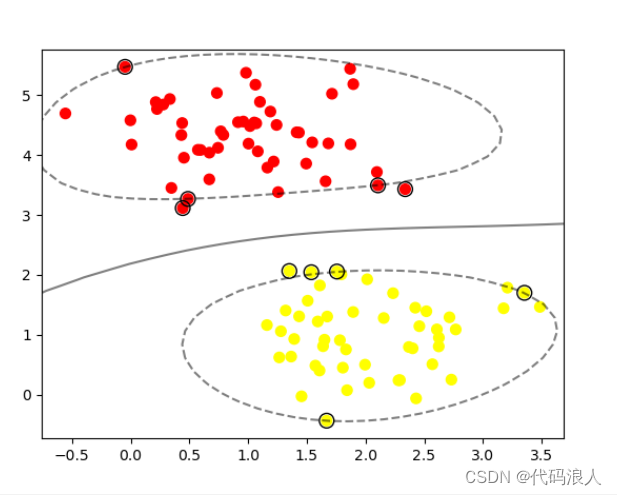
在svm 算法中,在数据点处于决定的边界上,这些特殊的数据被称支持向量。这也是支持向量机的名称由来
5.2 实战
5.2.1 多项式内核
# 导入所需的库
import numpy as np
from sklearn import svm  # 导入支持向量机模块
from sklearn.datasets import make_blobs  # 导入用于生成样本数据的函数
import matplotlib.pyplot as plt  # 导入用于绘图的库

# 生成样本数据
X, y = make_blobs(n_samples=100, centers=2, random_state=0, cluster_std=0.6)
# 使用 make_blobs 函数生成一个包含两个类别的样本数据集
# n_samples 表示生成样本的数量
# centers 表示类别的数量
# random_state 是随机种子,用于生成可重复的结果
# cluster_std 表示每个类别的标准差,用于控制数据点的分布

# 创建SVM分类器
clf = svm.SVC(kernel='linear')
# 使用 sklearn 中的 SVC 函数创建一个线性 SVM 分类器
# kernel 参数指定了核函数类型,这里选择了线性核函数

# 训练模型
clf.fit(X, y)
# 使用 fit 方法对 SVM 分类器进行训练
# X 是输入特征向量,y 是对应的目标变量

# 绘制决策边界
plt.scatter(X[:, 0], X[:, 1], c=y, s=50, cmap='autumn')
# 使用 scatter 函数绘制样本数据散点图
# X[:, 0] 表示取所有样本数据的第一个特征作为 x 坐标
# X[:, 1] 表示取所有样本数据的第二个特征作为 y 坐标
# c=y 表示根据目标变量 y 的值给散点图上的点着色
# s=50 表示散点的大小为 50
# cmap='autumn' 表示使用 autumn 颜色映射将不同类别的点用不同的颜色表示

ax = plt.gca()
xlim = ax.get_xlim()
ylim = ax.get_ylim()

# 创建网格以绘制决策边界
xx = np.linspace(xlim[0], xlim[1], 30)
yy = np.linspace(ylim[0], ylim[1], 30)
YY, XX = np.meshgrid(yy, xx)
xy = np.vstack([XX.ravel(), YY.ravel()]).T
Z = clf.decision_function(xy).reshape(XX.shape)
# 创建一个网格,用于绘制决策边界
# np.linspace 生成一维数组,表示 x 和 y 坐标的取值范围
# np.meshgrid 生成二维坐标矩阵,表示网格中每个点的坐标
# np.vstack 将两个一维数组堆叠为一个二维数组
# clf.decision_function 用于计算每个网格点到决策边界的距离
# reshape 用于将一维数组转换为二维矩阵

# 绘制决策边界和支持向量
ax.contour(XX, YY, Z, colors='k', levels=[-1, 0, 1], alpha=0.5, linestyles=['--', '-', '--'])
# 使用 contour 函数绘制等高线图,表示决策边界
# XX 和 YY 表示网格点的坐标矩阵
# Z 表示每个网格点到决策边界的距离
# colors='k' 表示等高线的颜色为黑色
# levels=[-1, 0, 1] 表示绘制等高线的值为 -1、0 和 1
# alpha=0.5 表示等高线的透明度为 0.5
# linestyles=['--', '-', '--'] 表示等高线的线型为虚线、实线和虚线

ax.scatter(clf.support_vectors_[:, 0], clf.support_vectors_[:, 1], s=100, linewidth=1, facecolors='none', edgecolors='k')
# 使用 scatter 函数绘制支持向量
# clf.support_vectors_ 返回模型中的支持向量
# [:, 0] 和 [:, 1] 分别表示取支持向量的第一个和第二个特征作为 x 和 y 坐标
# s=100 表示支持向量的大小为 100
# linewidth=1 表示边界线的宽度为 1
# facecolors='none' 表示支持向量不填充颜色
# edgecolors='k' 表示支持向量的边界线颜色为黑色

plt.show()
# 显示绘制的图形

5.2.2 径向基内核(RBF)
clf = svm.SVC(kernel=‘linear’)
替换为
clf = svm.SVC(kernel=‘rbf’)

原文地址:https://blog.csdn.net/huiguo_/article/details/135411437
本文来自互联网用户投稿,该文观点仅代表作者本人,不代表本站立场。本站仅提供信息存储空间服务,不拥有所有权,不承担相关法律责任。
如若转载,请注明出处:http://www.7code.cn/show_62061.html
如若内容造成侵权/违法违规/事实不符,请联系代码007邮箱:suwngjj01@126.com进行投诉反馈,一经查实,立即删除!


