简单线性回归,是一种使用单个特征预测响应的方法。 它是机器学习爱好者了解的最基本的机器学习模型之一。 在线性回归中,我们假设两个变量,即因变量和自变量是线性相关的。 因此,我们尝试找到一个线性函数,作为特征或自变量 (x) 的函数,尽可能准确地预测响应值 (y)。 让我们考虑一个数据集,其中每个特征 x 都有一个响应 y 值:
x
0
1
2
3
4
5
6
7
8
9
y
1
3
2
5
7
8
8
9
10
12
begin{array}{|c|c|c|c|c|c|c|c|c|c|c|} hline mathbf{x} & 0 & 1 & 2 & 3 & 4 & 5 & 6 & 7 & 8 & 9 \ hline mathbf{y} & 1 & 3 & 2 & 5 & 7 & 8 & 8 & 9 & 10 & 12 \ hline end{array}
xy0113223547586879810912
为了一般性,我们定义:
x
=
[
x
−
1
,
x
−
2
,
…
,
x
−
n
]
x=left[x_{-} 1, x_{-} 2, ldots, x_{-} nright]
x=[x−1,x−2,…,x−n]
y
=
[
y
−
1
,
y
−
2
,
…
,
y
−
n
]
y=left[y_{-} 1, y_{-} 2, ldots, y_{-} nright]
y=[y−1,y−2,…,y−n]
对于 n 个观测值(在上面的示例中,n=10)。上述数据集的散点图如下所示:
现在,任务是在上面的散点图中找到一条最适合的线,以便我们可以预测任何新特征值的响应。 (即数据集中不存在 x 的值)这条线称为回归线。 回归线的方程表示为:
h
(
x
i
)
=
β
0
+
β
1
x
i
hleft(x_iright)=beta_0+beta_1 x_i
h(xi)=β0+β1xi
β
0
beta_0
β0 和
β
1
β1 的值。一旦我们估计了这些系数,我们就可以使用该模型来预测响应!
y
i
=
β
0
+
β
1
x
i
+
ε
i
=
h
(
x
i
)
+
ε
i
⇒
ε
i
=
y
i
−
h
(
x
i
)
y_i=beta_0+beta_1 x_i+varepsilon_i=hleft(x_iright)+varepsilon_i Rightarrow varepsilon_i=y_i-hleft(x_iright)
yi=β0+β1xi+εi=h(xi)+εi⇒εi=yi−h(xi)
这里,
ε
i
εi 是第 i 个观测值的残差。因此,我们的目标是最小化总残差。我们将平方误差或成本函数 J 定义为:
J
(
β
0
,
β
1
)
=
1
2
n
∑
i
=
1
n
ε
i
2
Jleft(beta_0, beta_1right)=frac{1}{2 n} sum_{i=1}^n varepsilon_i^2
J(β0,β1)=2n1i=1∑nεi2
我们的任务是找到使
J
(
β
0
,
β
1
)
J(β0,β1) 最小的
β
0
beta_0
β0 和
β
1
beta_1
β
1
=
S
S
x
y
S
S
x
:
x
β
0
=
y
ˉ
−
β
1
x
ˉ
begin{gathered} beta_1=frac{S S_{x y}}{S S_{x: x}} \ beta_0=bar{y}-beta_1 bar{x} end{gathered}
β1=SSx:xSSxyβ0=yˉ−β1xˉ
其中
S
S
x
y
S S_{x y}
SSxy 是 y 和 x 的交叉偏差之和:
S
S
x
y
=
∑
i
=
1
n
(
x
i
−
x
ˉ
)
(
y
i
−
y
ˉ
)
=
∑
i
=
1
n
y
i
x
i
−
n
x
ˉ
y
ˉ
S S_{x y}=sum_{i=1}^nleft(x_i-bar{x}right)left(y_i-bar{y}right)=sum_{i=1}^n y_i x_i-n bar{x} bar{y}
SSxy=i=1∑n(xi−xˉ)(yi−yˉ)=i=1∑nyixi−nxˉyˉ
S
S
x
x
S S_{x x}
S
S
x
x
=
∑
i
=
1
n
(
x
i
−
x
ˉ
)
2
=
∑
i
=
1
n
x
i
2
−
n
(
x
ˉ
)
2
S S_{x x}=sum_{i=1}^nleft(x_i-bar{x}right)^2=sum_{i=1}^n x_i^2-n(bar{x})^2
SSxx=i=1∑n(xi−xˉ)2=i=1∑nxi2−n(xˉ)2
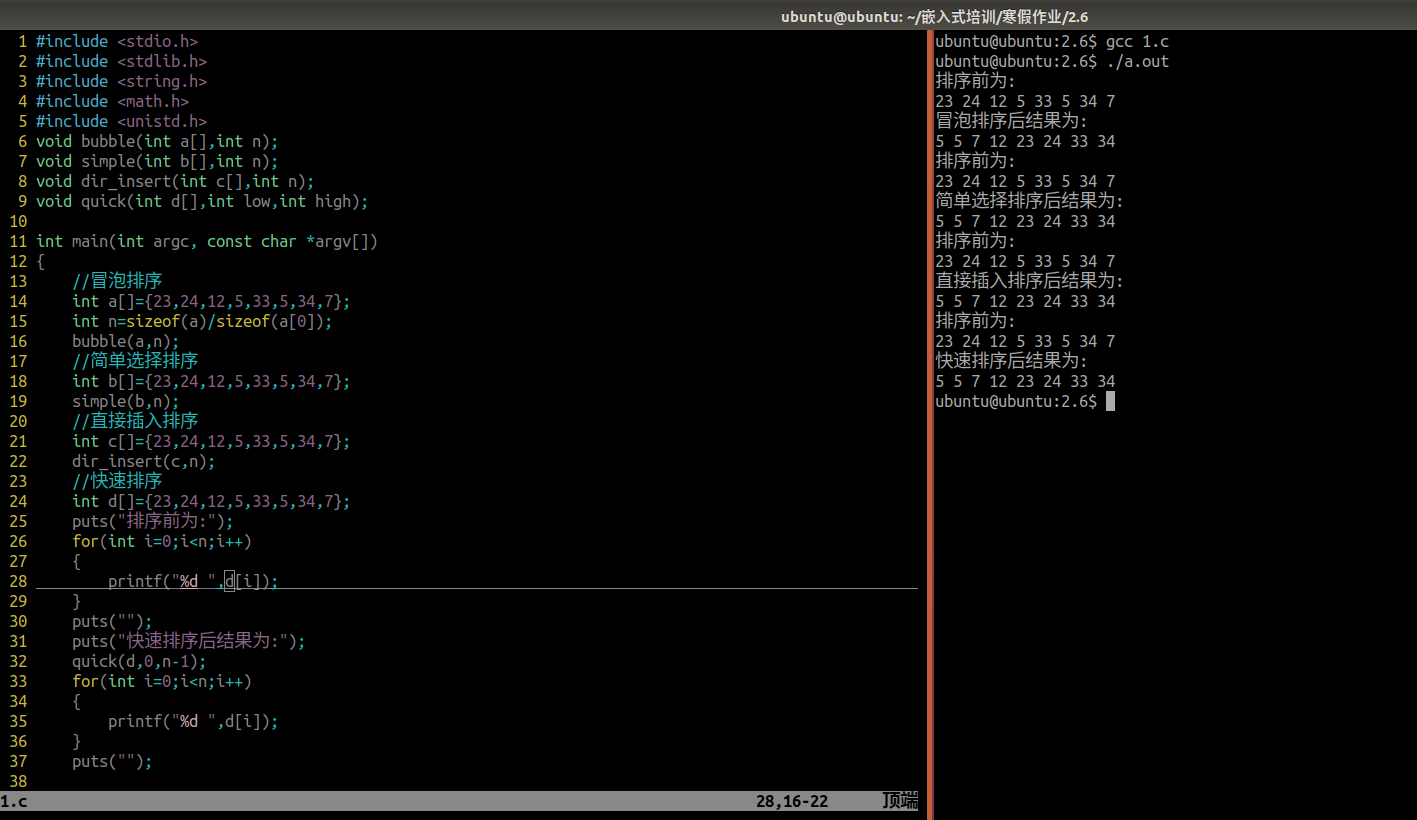
我们可以使用Python语言来学习线性回归模型的系数。为了绘制输入数据和最佳拟合线,我们将使用 matplotlib 库。它是最常用的用于绘制图表的 Python 库之一。
import numpy as np
import matplotlib.pyplot as plt

def estimate_coef(x, y):
	# number of observations/points
	n = np.size(x)

	# mean of x and y vector
	m_x = np.mean(x)
	m_y = np.mean(y)

	# calculating cross-deviation and deviation about x
	SS_xy = np.sum(y*x) - n*m_y*m_x
	SS_xx = np.sum(x*x) - n*m_x*m_x

	# calculating regression coefficients
	b_1 = SS_xy / SS_xx
	b_0 = m_y - b_1*m_x

	return (b_0, b_1)

def plot_regression_line(x, y, b):
	# plotting the actual points as scatter plot
	plt.scatter(x, y, color = "m",
			marker = "o", s = 30)

	# predicted response vector
	y_pred = b[0] + b[1]*x

	# plotting the regression line
	plt.plot(x, y_pred, color = "g")

	# putting labels
	plt.xlabel('x')
	plt.ylabel('y')

	# function to show plot
	plt.show()

def main():
	# observations / data
	x = np.array([0, 1, 2, 3, 4, 5, 6, 7, 8, 9])
	y = np.array([1, 3, 2, 5, 7, 8, 8, 9, 10, 12])

	# estimating coefficients
	b = estimate_coef(x, y)
	print("Estimated coefficients:nb_0 = {}
		nb_1 = {}".format(b[0], b[1]))

	# plotting regression line
	plot_regression_line(x, y, b)

if __name__ == "__main__":
	main()
输出:
Estimated coefficients:
b_0 = -0.0586206896552
b_1 = 1.45747126437
多元线性回归
Python简单线性回归建立电视广播报纸销售额模型
Python简单线性回归分析职场经验和薪水关系
TensorFlow.js创建简单线性回归
参阅 – 亚图跨际
原文地址:https://blog.csdn.net/jiyotin/article/details/134696560
本文来自互联网用户投稿,该文观点仅代表作者本人,不代表本站立场。本站仅提供信息存储空间服务,不拥有所有权,不承担相关法律责任。
如若转载,请注明出处:http://www.7code.cn/show_8307.html
如若内容造成侵权/违法违规/事实不符,请联系代码007邮箱:suwngjj01@126.com进行投诉反馈,一经查实,立即删除!