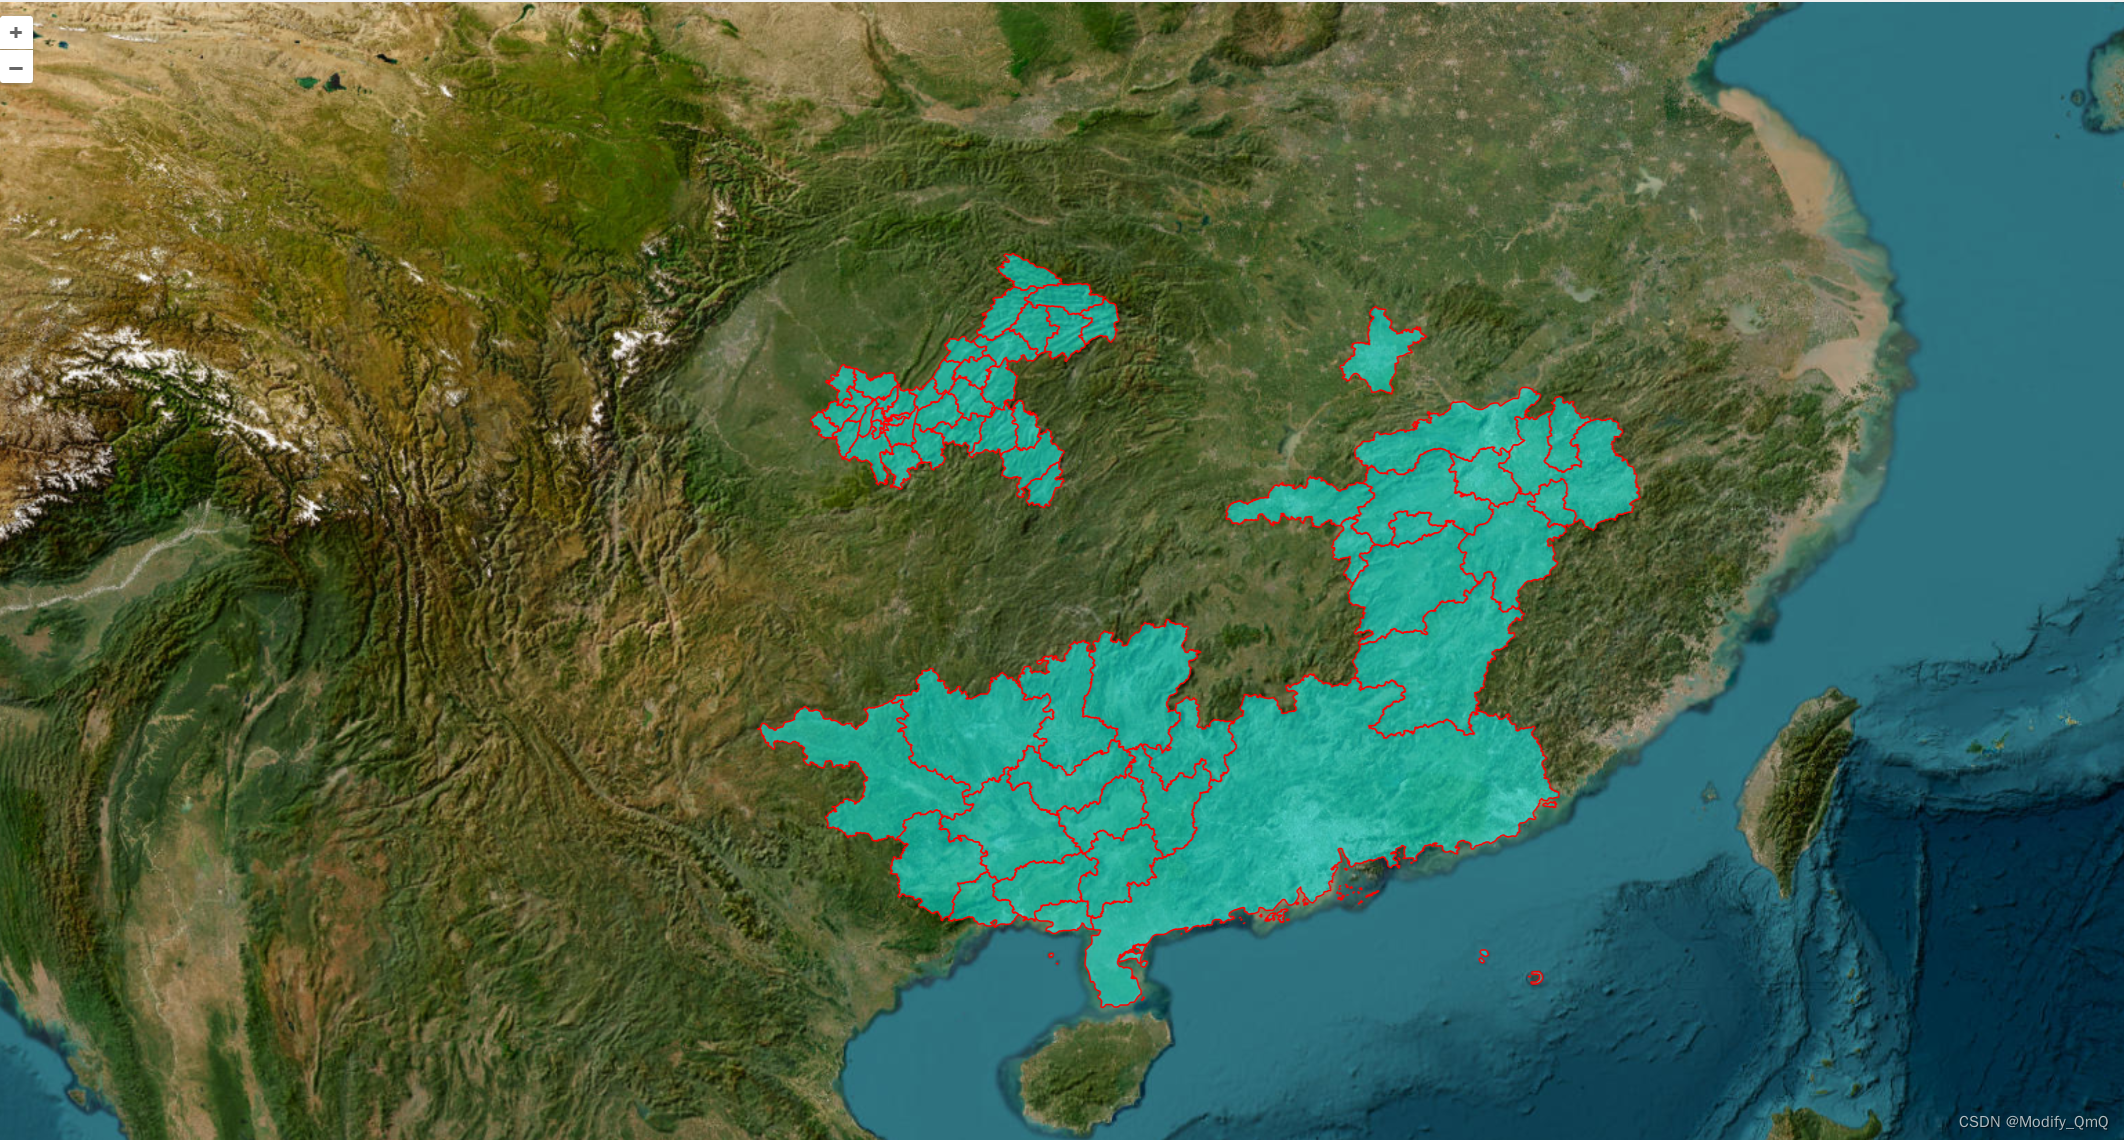
本文介绍: 深入探讨了OpenLayers中多边形和GeoJson边界的绘制方法。首先,我们介绍了OpenLayers的基本概念和功能,然后详细解析了如何使用OpenLayers绘制多边形。接着,我们深入探讨了GeoJson数据格式的特点和应用,以及如何在OpenLayers中使用GeoJson数据进行边界绘制。最后,我们通过实例演示了如何结合多边形和GeoJson进行复杂的地图边界绘制
1.1、绘制多边形
在绘制多边形和前面绘制线有异曲同工之妙,多边形本质上就是由多个点组成的线然后连接组成的面,这个面就是最终的结果,那么这里使用到的是Polygon对象,而传给这个对象的值也是多个坐标,坐标会一个个的连起来组成一个面,而绘制多边形只需要塞进去多少个顶点即可
const vectorSource = new VectorSource();
const vectorLayer = new VectorLayer({
  source: vectorSource
});
this.map.addLayer(vectorLayer);
const coordinates = [
  this.getRandomSmallCoordinate(),
  this.getRandomSmallCoordinate(),
  this.getRandomSmallCoordinate(),
  this.getRandomSmallCoordinate()
];
const polygonGeometry = new Polygon([coordinates]);

const polygonFeature = new Feature(polygonGeometry);

polygonFeature.setStyle(
  new Style({
    stroke: new Stroke({
      color: "red",
      width: 2
    }),
    fill: new Fill({
      color: "rgba(255,255,0,0.7)"
    })
  })
);

vectorSource.addFeature(polygonFeature);

1.2、绘制geoJson数据
在这里可以通过 GeoJSON 读取 GeoJSON 格式读取和写入数据的要素格式,在echart当中渲染地图也是使用这种数据格式的,那么这样的话就可以获取对应的geojson文件来把对应的地图渲染到地图上。
这里用到的json文件可以去网站上【阿里云数据可视化平台】进行下载,这里使用一个json文件进行加载渲染,
let features = new GeoJSON().readFeatures(require('./mapJson/changsha.json'));
var vectorSource = new VectorSource({ features: features });
let lineLayer = new VectorLayer({
  id: item.id,
  name: "hunan border",
  opacity: 1,
  zIndex: 1,
  source: vectorSource
});
this.map.addLayer(lineLayer);

原文地址:https://blog.csdn.net/qq_44973159/article/details/134534456
本文来自互联网用户投稿,该文观点仅代表作者本人,不代表本站立场。本站仅提供信息存储空间服务,不拥有所有权,不承担相关法律责任。
如若转载,请注明出处:http://www.7code.cn/show_8775.html
如若内容造成侵权/违法违规/事实不符,请联系代码007邮箱:suwngjj01@126.com进行投诉反馈,一经查实,立即删除!
声明:本站所有文章,如无特殊说明或标注,均为本站原创发布。任何个人或组织,在未征得本站同意时,禁止复制、盗用、采集、发布本站内容到任何网站、书籍等各类媒体平台。如若本站内容侵犯了原著者的合法权益,可联系我们进行处理。


