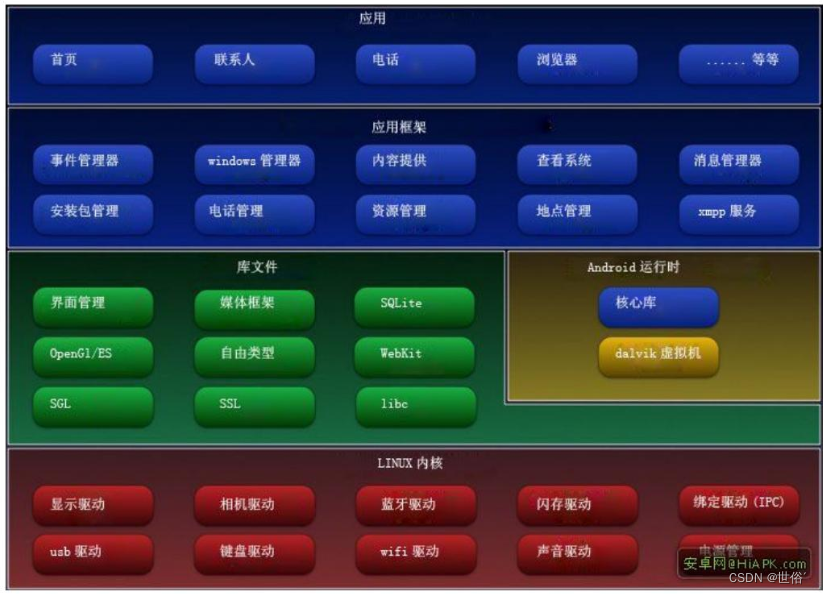
本系列篇主要介绍下Android非常火爆的三方图表库MpAndroidChart的使用。可能在大多数情况下,我们很少会在Android端去开发图表,一般情况下图表都会在PC端用H5去展示。但如果说做一些金融财经类、工厂类、统计类、大数据类等的app,肯定会涉及到到数据可视化分析,那么你绝对会用到MpAndroidChart。
一、前言
2018年,那年的我还没进入互联网。当时开发一个大数据平台项目,因此调研了Android端主流的图表三方库。其中,包括功能强大的MpAndroidChart、使用简单且体积较小的HelloCharts,以及在web前端非常火的Echarts。
回到2023年的今天,我们再次去github瞄一眼。以当前github的star数来看,Echarts仍然是最强大的图表库,支持的图表种类也是最丰富的。然而由于Echarts不是NA的,在Android端使用并不方便。当然这不代表无法使用,我们可以让前端同学做一个H5页面,在WebView中去加载h5页面间接使用它。


作为Android端的开发同学,既然我们可以NA来实现,那就不要考虑h5这种方式了。 其实绝大多数情况下,客户端展示的图表不会太花里胡哨,MpAndroidChart完全可以满足我们的诉求。
二、最强实践攻略
2018年我调研和使用MpAndroidChart3的时候,就发现了一些问题。而这些问题我通过查阅网上的资料,根本没发解决,其中不乏一些错误或片面的说法。我称该篇为MpAndroidChart最强实践攻略。
当前网上90%资料是MpAndroidChart2的,MpAndroidChart3跟MpAndroidChart2差别非常大,而本系列攻略基于最新的MpAndroidChart3。
当前网上资料,都是复制粘贴,有很多的错误,比较经典的就是多组柱状图的分组问题,而本系列会整理MpAndroidChart3常见问题。
三、MpAndroidChart支持的图表类型
MpAndroidChart除支持常见的柱状图(BarChart)、折线图(LineChart)、饼形图(PieChart)外,还支持例如散点图(ScatterChart)、K线图(CandleStickChart)、气泡图(BubbleChart)、雷达图(RadarChart)等,并且支持例如柱状图和折线图的组合图。
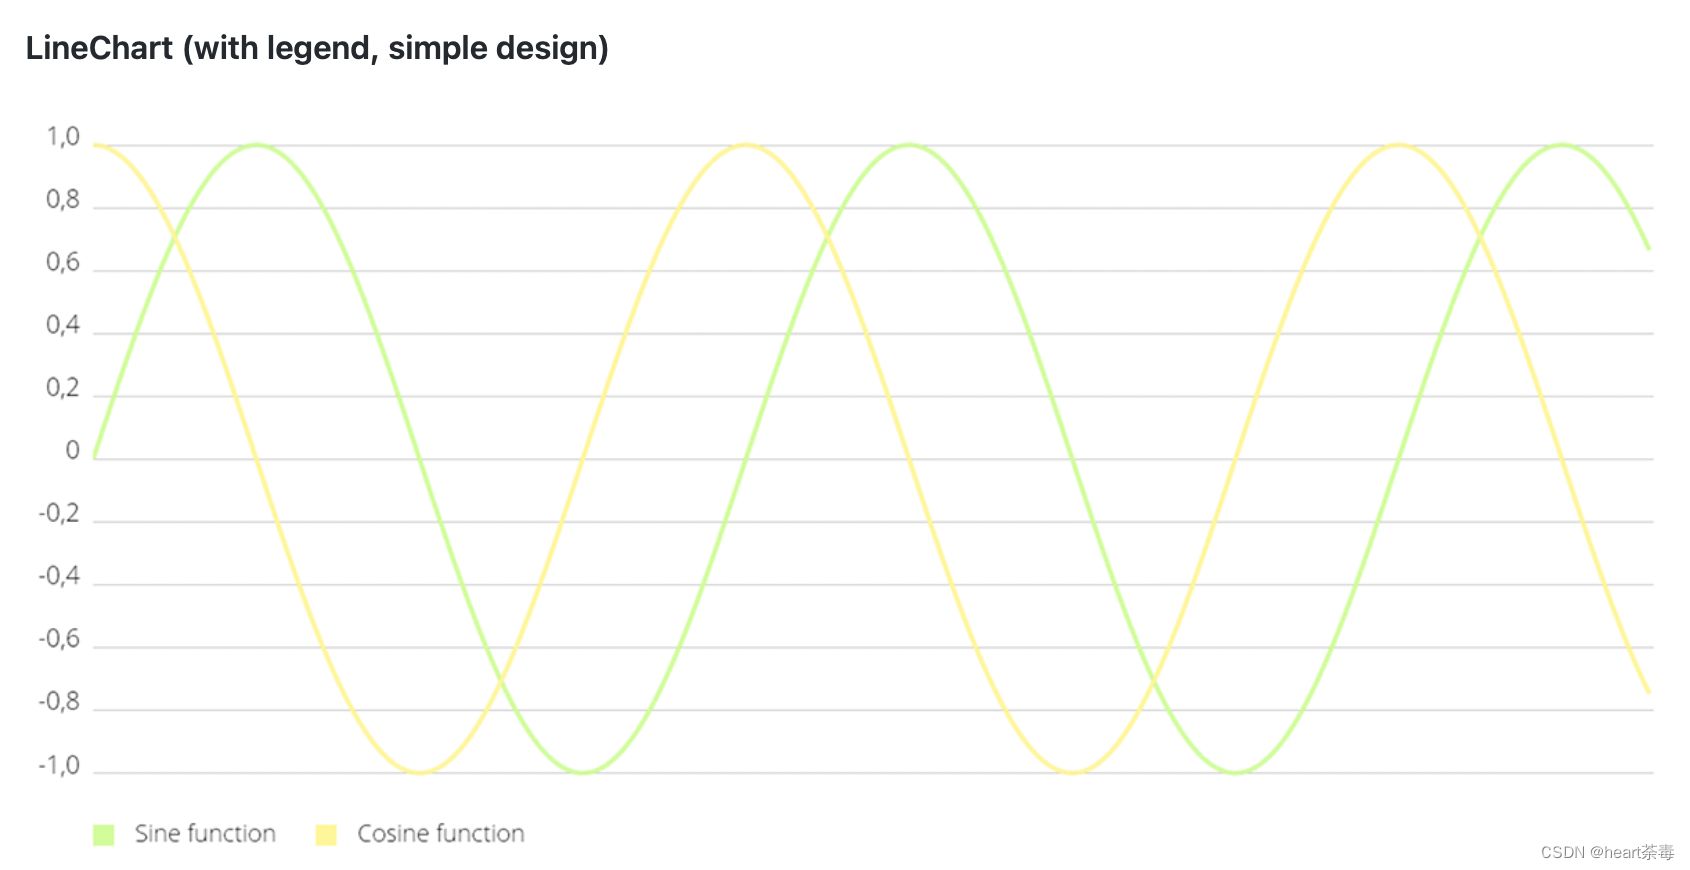

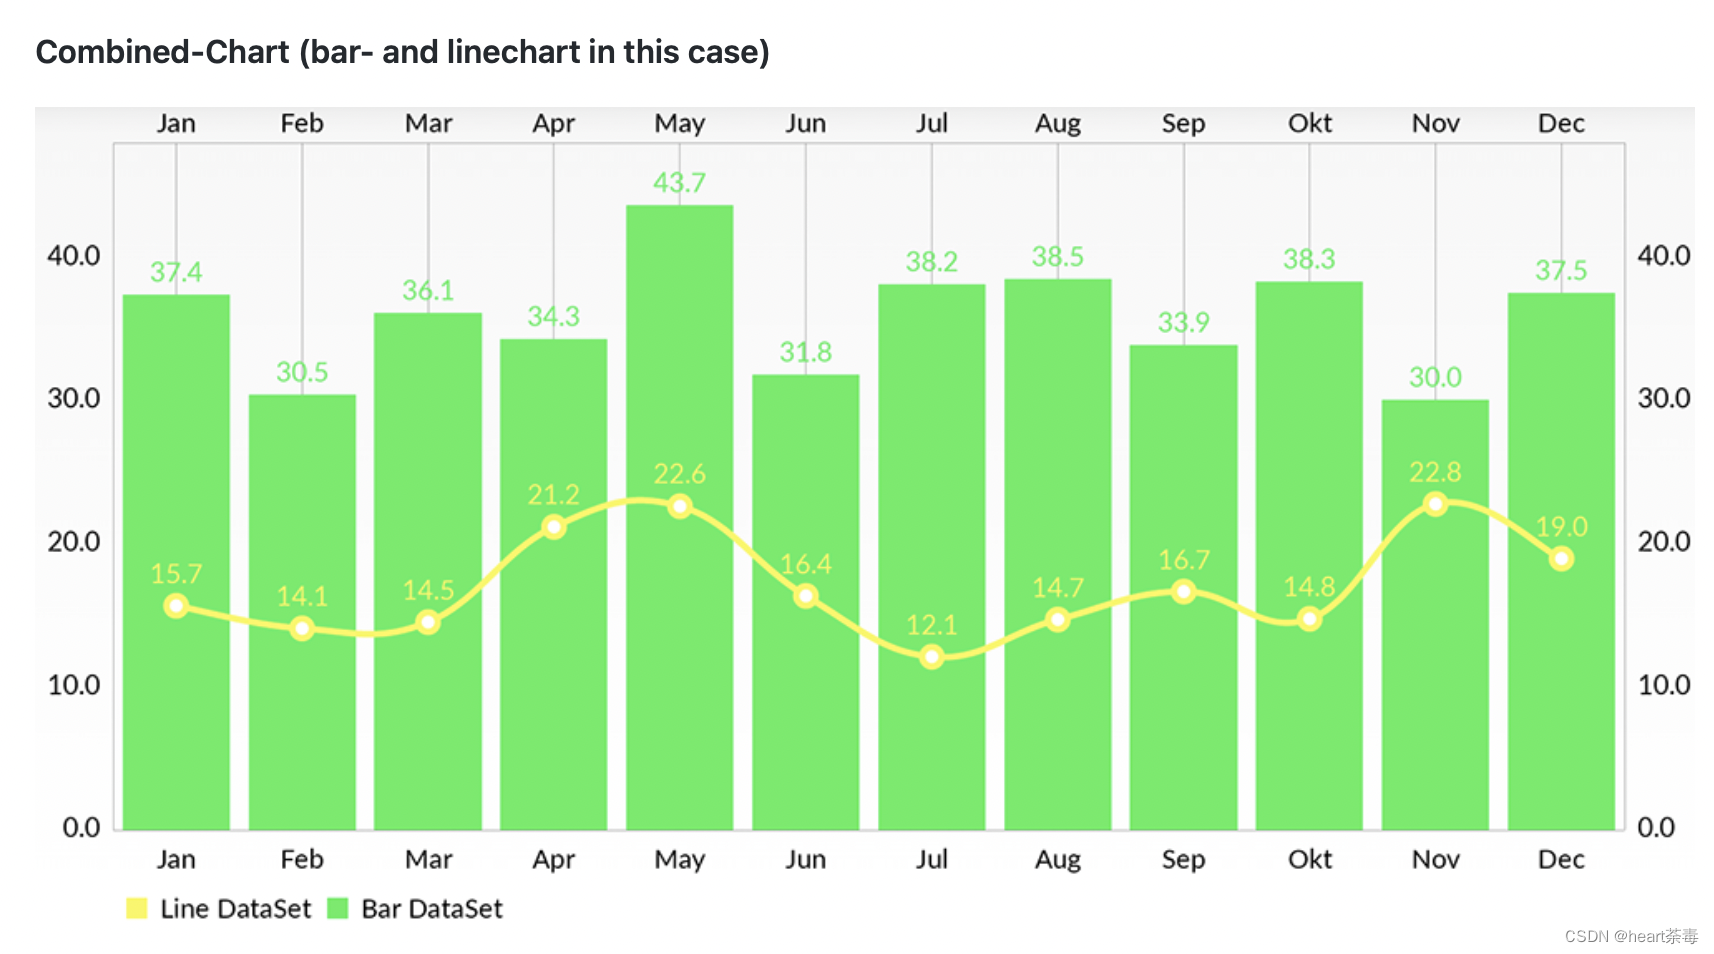
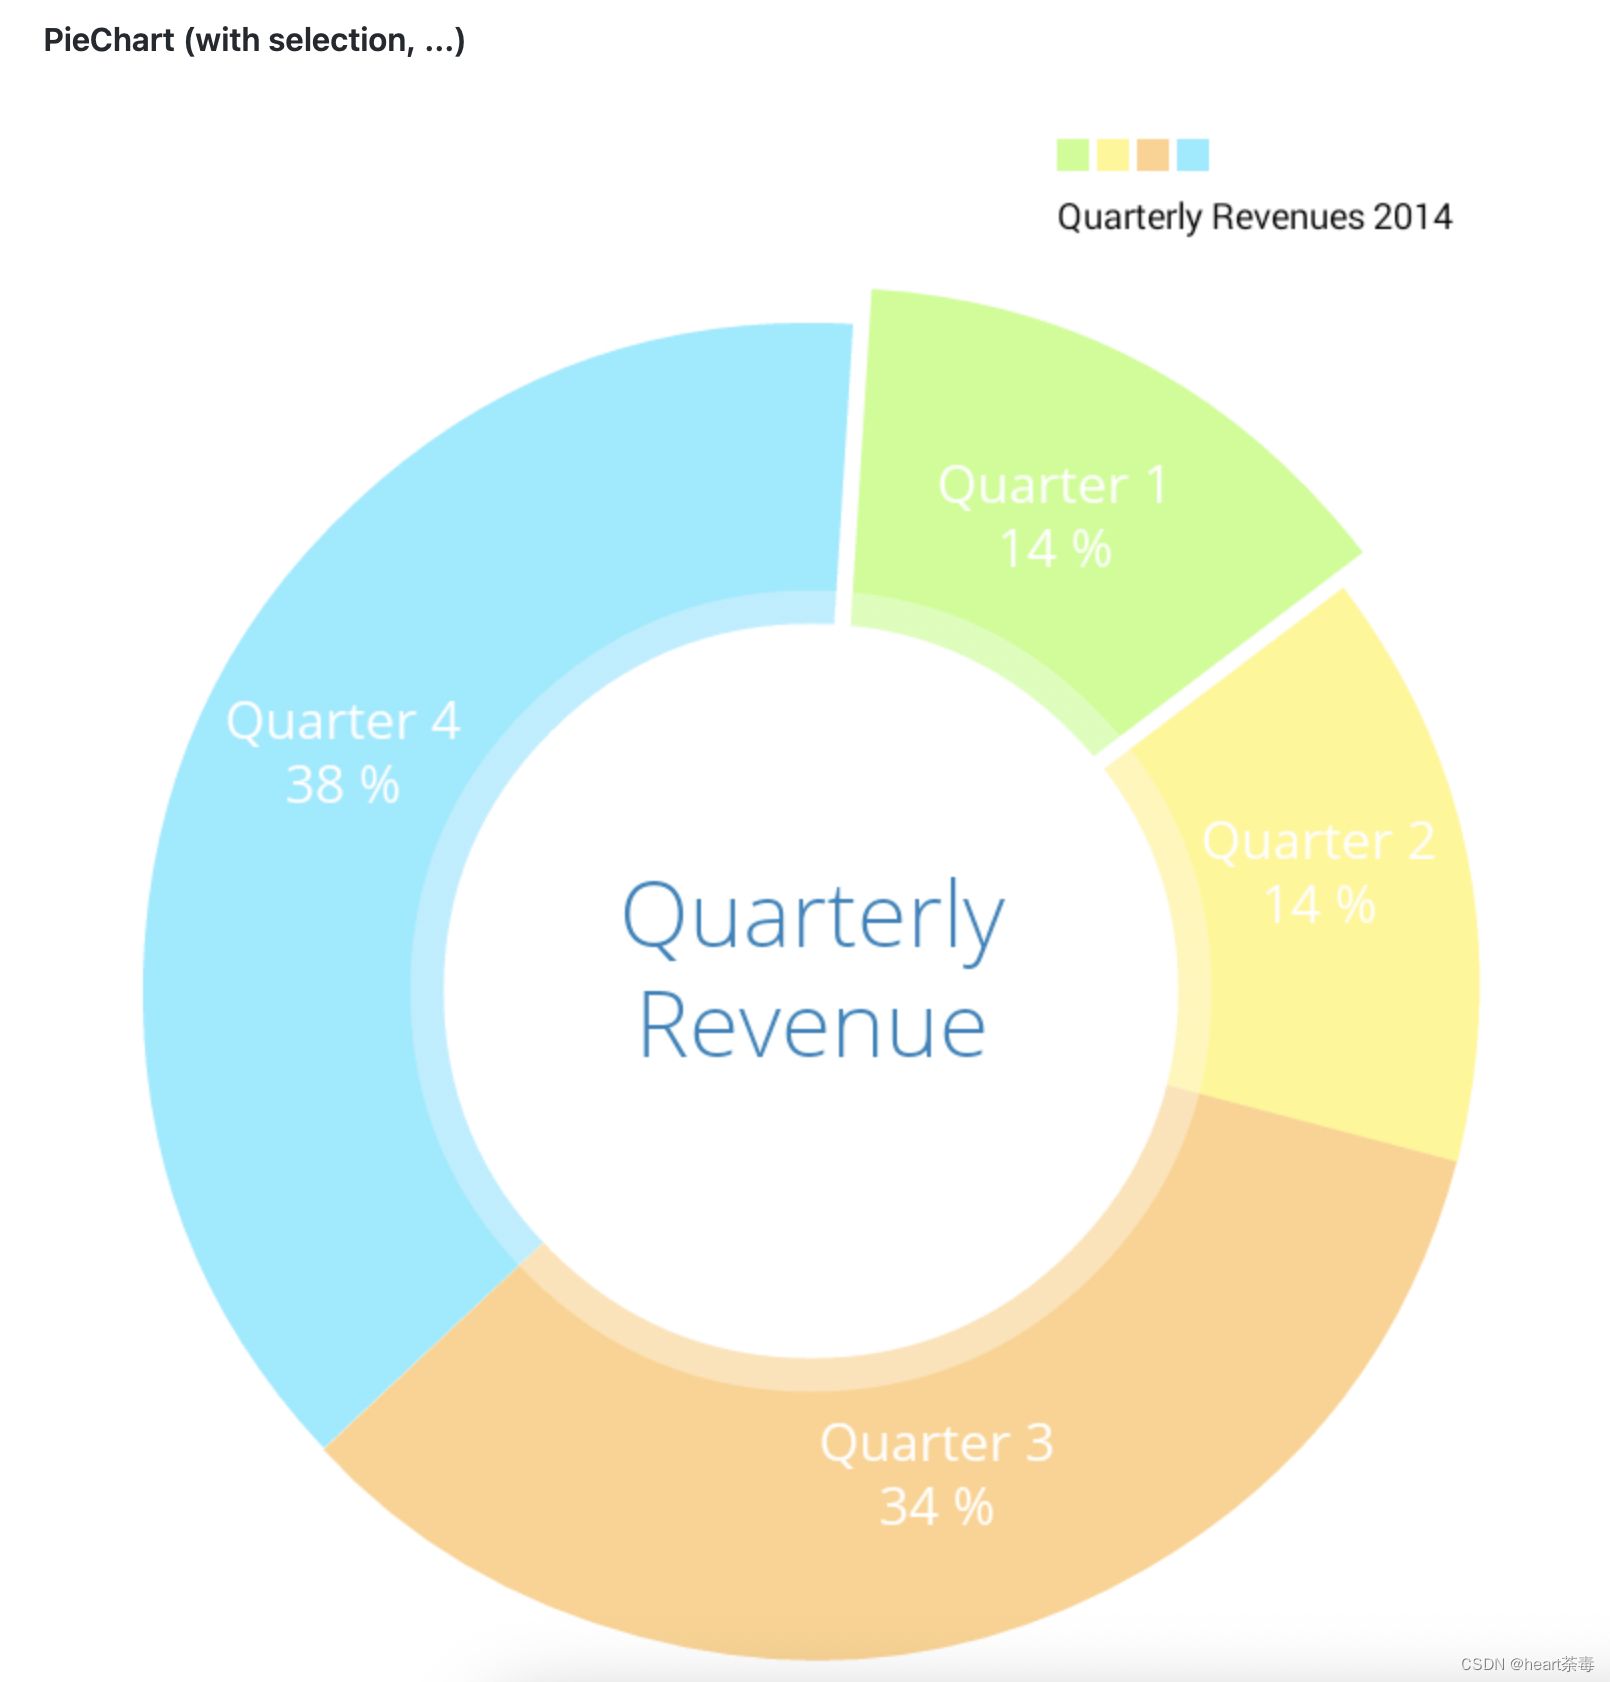

以上是对MpAndroidChart3的系统介绍,通过官方的一些示例来看,MpAndroidChart3的功能还是非常强大的。接下来通过对MpAndroidChart3的一些实战编码,来完整的总结MpAndroidChart3。
四、柱形图
什么是柱形图?简单来讲,就是那种一个柱一个柱组成的图。真是听君一席话,如听一席话。。。看下百度百科的官方解释:
1、单组柱状图
从百度图片随便搜了个柱形图,长这样,应该是统计七大洲平均海拔高度的柱形图,那我们接下来基于MpAndroidChart的BarChart去实现一样的效果。

首先,这是单柱的简单柱形图,数据源比较简单,就是一组七大洲的海拔高度数据,那我们直接按照api设置一下就好了。
/**
* 设置数据源
*/
private void setData() {
List<BarEntry> barEntries = new ArrayList<>();
barEntries.add(new BarEntry(0,1500));
barEntries.add(new BarEntry(1,500));
barEntries.add(new BarEntry(2,1500));
barEntries.add(new BarEntry(3,2000));
barEntries.add(new BarEntry(4,1000));
barEntries.add(new BarEntry(5,500));
barEntries.add(new BarEntry(6,1));
BarDataSet barDataSet = new BarDataSet(barEntries,"标题一");
BarData ba = new BarData(barDataSet);
mBarChart.setData(ba);
}效果长这样,非常原始的风格,看上去乱糟糟的,非常糟糕:
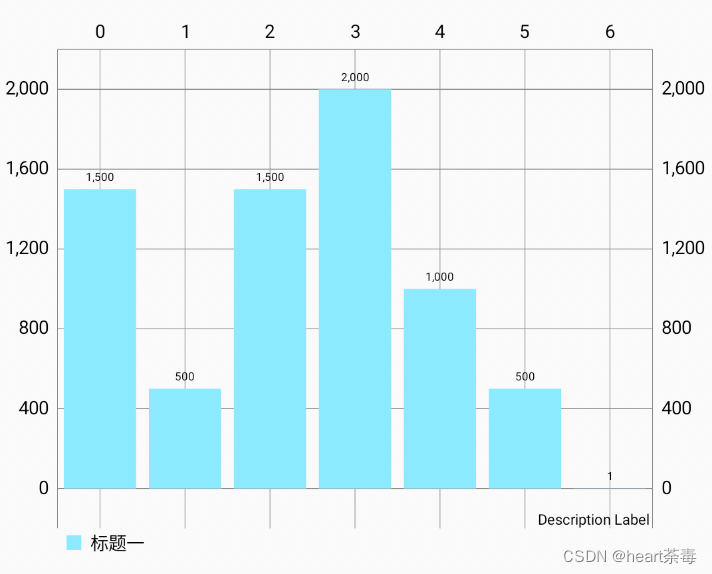
如果我们不对柱形图去做一些UI的设置,那么默认的效果是比较粗犷且不美观的。因此,接下来我们一步步去美化这个柱形图。
1、为不同的柱设置不同的颜色
/**
* 设置数据源
*/
private void setData() {
List<BarEntry> barEntries = new ArrayList<>();
barEntries.add(new BarEntry(0,1500));
barEntries.add(new BarEntry(1,500));
barEntries.add(new BarEntry(2,1500));
barEntries.add(new BarEntry(3,2000));
barEntries.add(new BarEntry(4,1000));
barEntries.add(new BarEntry(5,500));
barEntries.add(new BarEntry(6,1));
BarDataSet barDataSet = new BarDataSet(barEntries,"标题一");
// 设置颜色
List<Integer> colors = new ArrayList<>();
colors.add(Color.GRAY);
colors.add(Color.GREEN);
colors.add(Color.BLUE);
colors.add(Color.RED);
colors.add(Color.YELLOW);
colors.add(Color.CYAN);
colors.add(Color.BLACK);
barDataSet.setColors(colors);
BarData ba = new BarData(barDataSet);
mBarChart.setData(ba);
}2、设置柱形图的样式
    private void initUI(){
        // 不显示图例
        mBarChart.getLegend().setEnabled(false);
        // 不显示描述
        mBarChart.getDescription().setEnabled(false);
        // 左右空出barWidth/2,更美观
        mBarChart.setFitBars(true);
        // 不绘制网格
        mBarChart.setDrawGridBackground(false);

        XAxis xAxis = mBarChart.getXAxis();
        // 设置x轴显示在下方
        xAxis.setPosition(XAxisPosition.BOTTOM);
        // 设置x轴不画线
        xAxis.setDrawGridLines(false);
        // 设置自定义的ValueFormatter
        String[] labels = {"北美洲","南美洲","欧洲","亚洲","大洋洲","非洲","南极洲"};
        xAxis.setValueFormatter(new ValueFormatter() {
            @Override
            public String getFormattedValue(float value) {
                int index = (int) value;
                return labels[index];
            }
        });

        // 设置左y轴
        YAxis yAxis = mBarChart.getAxisLeft();
        // 设置y-label显示在图表外
        yAxis.setPosition(YAxisLabelPosition.OUTSIDE_CHART);
        // Y轴从0开始,不然会上移一点
        yAxis.setAxisMinimum(0f);
        // 设置y轴不画线
        yAxis.setDrawGridLines(false);
        // 不显示右y轴
        YAxis rightAxis = mBarChart.getAxisRight();
        rightAxis.setEnabled(false);
}优化后,新的柱形图长这样:

2、多组柱状图
上面的例子是非常简单的柱状图,接下来,我们绘制如下一个柱状图:描述2022年Q1-Q4四家企业苹果、微软、亚马逊、谷歌的收入情况的柱状图。分三步走:
    private void setChartData() {

        List<BarEntry> barEntries1 = new ArrayList<>();
        barEntries1.add(new BarEntry(0, 1500));
        barEntries1.add(new BarEntry(1, 1400));
        barEntries1.add(new BarEntry(2, 800));
        barEntries1.add(new BarEntry(3, 2000));
        BarDataSet barDataSet1 = new BarDataSet(barEntries1, "Q1");

        List<BarEntry> barEntries2 = new ArrayList<>();
        barEntries2.add(new BarEntry(0, 1000));
        barEntries2.add(new BarEntry(1, 1200));
        barEntries2.add(new BarEntry(2, 1500));
        barEntries2.add(new BarEntry(3, 900));
        BarDataSet barDataSet2 = new BarDataSet(barEntries2, "Q2");

        List<BarEntry> barEntries3 = new ArrayList<>();
        barEntries3.add(new BarEntry(0, 900));
        barEntries3.add(new BarEntry(1, 1000));
        barEntries3.add(new BarEntry(2, 1200));
        barEntries3.add(new BarEntry(3, 1500));
        BarDataSet barDataSet3 = new BarDataSet(barEntries3, "Q3");

        List<BarEntry> barEntries4 = new ArrayList<>();
        barEntries4.add(new BarEntry(0, 1400));
        barEntries4.add(new BarEntry(1, 800));
        barEntries4.add(new BarEntry(2, 1000));
        barEntries4.add(new BarEntry(3, 500));
        BarDataSet barDataSet4 = new BarDataSet(barEntries4, "Q4");

        List<Integer> colors = new ArrayList<>();
        colors.add(Color.GREEN);
        colors.add(Color.BLUE);
        colors.add(Color.RED);
        colors.add(Color.YELLOW);

        barDataSet1.setColor(colors.get(0));
        barDataSet2.setColor(colors.get(1));
        barDataSet3.setColor(colors.get(2));
        barDataSet4.setColor(colors.get(3));

        List<IBarDataSet> barDataSets = new ArrayList<>();
        barDataSets.add(barDataSet1);
        barDataSets.add(barDataSet2);
        barDataSets.add(barDataSet3);
        barDataSets.add(barDataSet4);

        BarData ba = new BarData(barDataSets);
        mBarChart.setData(ba);
} private void updateCommonUI(){
// 不显示图例
mBarChart.getLegend().setEnabled(false);
// 不显示描述
mBarChart.getDescription().setEnabled(false);
// 不绘制网格
mBarChart.setDrawGridBackground(false);
mBarChart.setScaleYEnabled(false);
mBarChart.setScaleXEnabled(false);
mBarChart.setScaleEnabled(false);
// 设置左y轴
YAxis yAxis = mBarChart.getAxisLeft();
// 设置y-label显示在图表外
yAxis.setPosition(YAxisLabelPosition.OUTSIDE_CHART);
// Y轴从0开始,不然会上移一点
yAxis.setAxisMinimum(0f);
// 设置y轴不画线
yAxis.setDrawGridLines(false);
// 不显示右y轴
YAxis rightAxis = mBarChart.getAxisRight();
rightAxis.setEnabled(false);
}3、初始化图表UI
private void updateChartUI() {
String[] labels = {"Q1", "Q2", "Q3", "Q4"};
XAxis xAxis = mBarChart.getXAxis();
// 设置自定义的ValueFormatter
xAxis.setValueFormatter(new ValueFormatter() {
@Override
public String getFormattedValue(float value) {
int index = (int) value;
// 注意不要数组越界
if (index >= 0 && index < labels.length) {
return labels[index];
}
return "";
}
});
// 设置x轴显示在下方
xAxis.setPosition(XAxisPosition.BOTTOM);
// 设置x轴不画线
xAxis.setDrawGridLines(false);
// 设置x轴标签从0开始
xAxis.setAxisMinimum(0);
// 设置x轴显示的最大标签数量
xAxis.setAxisMaximum(labels.length);
// x轴标签居中
xAxis.setCenterAxisLabels(true);
// 接下来这段代码尤其重要,网上几乎99%的资料说的都是错的,这里详解一下
// 1、要想标签跟group中间对齐,必须保证:(barWidth + barSpace) * group + groupSpace = granularity
// 2、granularity < 1,则右边会有空余;
// 3、granularity = 1,则刚好在一个屏幕显示开;
// 4、granularity > 1,则一个屏幕显示不开;
float barSpace = 0.025f;
float groupSpace = 0.1f;
float barWidth = 0.2f;
float granularity = (barWidth + barSpace) * labels.length + groupSpace;
xAxis.setGranularity(granularity);
mBarChart.setScaleX(granularity);
mBarChart.getBarData().setBarWidth(barWidth);
mBarChart.groupBars(0, groupSpace, barSpace);
}我在代码里有一大串非常重要的注释,正如我前文所说,关于多组柱状图的分组问题,网上的资料都是错的,我在这里再次拎出来,大家务必理解核心的代码:
// 接下来这段代码尤其重要,网上几乎99%的资料说的都是错的,这里详解一下
// 1、要想标签跟group中间对齐,必须保证:(barWidth + barSpace) * group + groupSpace = granularity
// 2、granularity < 1,则右边会有空余;
// 3、granularity = 1,则刚好在一个屏幕显示开;
// 3、granularity > 1,则一个屏幕显示不开;
float barSpace = 0.025f;
float groupSpace = 0.1f;
float barWidth = 0.2f;
float granularity = (barWidth + barSpace) * labels.length + groupSpace;
xAxis.setGranularity(granularity);
mBarChart.setScaleX(granularity);
mBarChart.getBarData().setBarWidth(barWidth);
mBarChart.groupBars(0, groupSpace, barSpace);
好,接下来我们运行看下效果:

还有点不完美的地方,没有画图例,后续我们一起看下如何添加图例。持续更新中……20230418
原文地址:https://blog.csdn.net/qq_21154101/article/details/129447583
本文来自互联网用户投稿,该文观点仅代表作者本人,不代表本站立场。本站仅提供信息存储空间服务,不拥有所有权,不承担相关法律责任。
如若转载,请注明出处:http://www.7code.cn/show_8815.html
如若内容造成侵权/违法违规/事实不符,请联系代码007邮箱:suwngjj01@126.com进行投诉反馈,一经查实,立即删除!

