<template>
<div id="centerBottomMap">
<div class="bg-color-black">
<div class="d-flex pt-2 pl-2">
<span>
<icon name="map" class="text-icon"></icon>
</span>
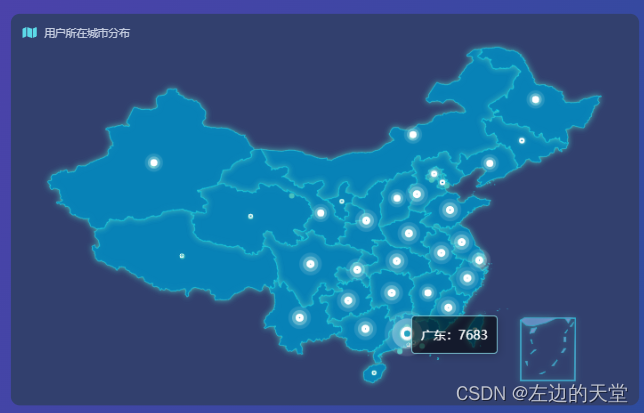
<span class="fs-xl text mx-2">用户所在城市分布</span>
</div>
<div class="d-flex ai-center flex-column body-box">
<centerMap :cdata="cdata"/>
</div>
</div>
</div>
</template>
<script>
import centerMap from '@/components/echart/centerMap'
import {getUserCityData} from "@/api/statistics";
export default {
data() {
return {
timing: null,
cdata: {}
}
},
components: {
centerMap
},
mounted() {
this.getData()
},
beforeDestroy () {
},
methods:{
getData() {
//从后台获取用户城市分布数据
getUserCityData().then(res => {
if (res.code === 0) {
this.cdata = {
regionCode: 'china',
data: res.data
}
console.info(this.cdata)
}
});
}
}
}
</script>
<style lang="scss" scoped>
#centerBottomMap {
$box-height: 440px;
$box-width: 100%;
height: $box-height;
width: $box-width;
border-radius: 5px;
padding: 0 16px;
min-width: $box-width;
.bg-color-black {
padding: 5px;
height: $box-height;
width: $box-width;
border-radius: 10px;
}
.text {
color: #c3cbde;
}
.body-box {
border-radius: 10px;
overflow: hidden;
.dv-cap-chart {
width: 100%;
height: 160px;
}
}
}
</style>
<template>
<Echart
:options="options"
ref="map"
height="410px"
width="680px"/>
</template>
<script>
import map from '@/common/map'
export default {
data() {
return {
length: 34,
options: {},
};
},
props: {
cdata: {
type: Object,
default: () => ({})
},
},
watch: {
cdata: {
handler (newData) {
if (newData !== undefined && newData.data !== undefined) {
let name = newData.regionCode
let _data = newData.data
let mapData = map.mapJson
this.$echarts.registerMap(name, mapData);
let cityCenter = {}
let arr = mapData.features;
//根据geo json获取省份中心点
arr.map((item) => {
cityCenter[item.properties.name] = item.properties.centroid || item.properties.center;
});
let data = [];
_data.map((item) => {
let name = item.name
let value = item.value || 0
if (cityCenter[name]) {
data.push({
name: name,
value: cityCenter[name].concat(value),
});
}
});
console.info(data)
this.length = data.length
this.init(name, data);
}
},
immediate: true,
deep: true
}
},
methods: {
init(name, data) {
let top = 30;
let zoom = 1.15
let scale = 0.95
this.options = {
backgroundColor: "rgba(0,0,0,0)",
tooltip: {
show: true,
trigger: 'item',
textStyle: {
fontSize: 16,
lineHeight: 22,
},
formatter: function (params) {
if (params.data) {
return params.name + ":" + params.data["value"][2];
} else {
return params.name;
}
},
backgroundColor: "rgba(0,0,0,.6)",
borderColor: "rgba(147, 235, 248, .8)",
textStyle: {
color: "#FFF",
},
position: point => {
// 固定在顶部
return [point[0] + 5, point[1] - 20];
},
},
legend: {
show: false,
},
visualMap: {
show: false,
left: 0,
bottom: 20,
pieces: [
{ gte: 1000, label: "1000个以上" }, // 不指定 max,表示 max 为无限大(Infinity)。
{ gte: 600, lte: 999, label: "600-999个" },
{ gte: 200, lte: 599, label: "200-599个" },
{ gte: 50, lte: 199, label: "49-199个" },
{ gte: 10, lte: 49, label: "10-49个" },
{ lte: 9, label: "1-9个" }, // 不指定 min,表示 min 为无限大(-Infinity)。
],
inRange: {
color: "#0782b7",
},
/*inRange: {
// 渐变颜色,从小到大
color: [
"#c3d7df",
"#5cb3cc",
"#8abcd1",
"#66a9c9",
"#2f90b9",
"#1781b5",
],
},*/
textStyle: {
color: "#fff",
},
},
geo: {
map: name,
roam: false,
selectedMode: false, //是否允许选中多个区域
zoom: zoom,
top: top,
aspectScale: scale, //长宽比
show: true,
},
series: [
{
type: "map",
map: name,
aspectScale: scale, //长宽比
zoom: zoom,
top: top,
data: data, //数据
selectedMode: false, //是否允许选中多个区域
geoIndex: 1,
//地图省份选中样式
emphasis: {
label: {
show: true,
},
itemStyle: {
areaColor: "#389BB7", // 背景色,默认是黄色
borderWidth: 1,
},
},
//地图背景色
itemStyle: {
color: "#47C1BF",
areaColor: 'rgba(19,54,162, .5)',
borderColor: 'rgba(0,242,252,.3)',
borderWidth: 1,
shadowBlur: 7,
shadowColor: '#47C1BF',
},
},
{
data: data || [],
type: "effectScatter",
coordinateSystem: "geo",
symbolSize: function (val) {
val = val[2] || 0
if (val >= 5000) return 10;
else if (val >= 1000) return 5;
else if (val >= 800) return 4;
else if (val >= 600) return 3;
else if (val >= 400) return 2;
else if (val >= 200) return 1;
else if (val >= 1) return 0.5;
else return 0;
},
legendHoverLink: true,
showEffectOn: "render",
rippleEffect: {
// period: 4,
scale: 6,
color: "rgba(255,255,255, 0.6)",
brushType: "fill",
},
//地图中心点显示样式
label: {
show: false,
formatter: (params) => {
if (params.data) {
return params.name + ":" + params.data["value"][2];
} else {
return params.name;
}
},
fontSize: 11,
offset: [0, 2],
position: "bottom",
textBorderColor: "#fff",
textShadowColor: "#000",
textShadowBlur: 10,
textBorderWidth: 0,
color: "#47C1BF",
},
// colorBy: "data",
itemStyle: {
color: "rgba(255,255,255,1)",
borderColor: "rgba(2255,255,255,2)",
borderWidth: 4,
shadowColor: "#47C1BF",
shadowBlur: 10,
}
}
]
}
// 重新选择区域
this.handleMapRandomSelect();
},
// 开启定时器
startInterval() {
const _self = this;
const time = 3000;
if (this.intervalId !== null) {
clearInterval(this.intervalId);
}
this.intervalId = setInterval(() => {
_self.reSelectMapRandomArea();
}, time);
},
// 重新随机选中地图区域
reSelectMapRandomArea() {
this.$nextTick(() => {
try {
let ref = this.$refs.map
if (ref) {
const map = ref.chart;
let index = Math.floor(Math.random() * this.length);
while (index === this.preSelectMapIndex || index >= this.length) {
index = Math.floor(Math.random() * this.length);
}
map.dispatchAction({
type: 'mapUnSelect',
seriesIndex: 0,
dataIndex: this.preSelectMapIndex,
});
map.dispatchAction({
type: 'showTip',
seriesIndex: 0,
dataIndex: index,
});
map.dispatchAction({
type: 'mapSelect',
seriesIndex: 0,
dataIndex: index,
});
this.preSelectMapIndex = index;
}
} catch (error) {
}
});
},
handleMapRandomSelect() {
this.$nextTick(() => {
try {
let ref = this.$refs.map
if (ref) {
const map = ref.chart;
const _self = this;
setTimeout(() => {
_self.reSelectMapRandomArea();
}, 0);
// 移入区域,清除定时器、取消之前选中并选中当前
map.on('mouseover', function (params) {
clearInterval(_self.intervalId);
map.dispatchAction({
type: 'mapUnSelect',
seriesIndex: 0,
dataIndex: _self.preSelectMapIndex,
});
map.dispatchAction({
type: 'mapSelect',
seriesIndex: 0,
dataIndex: params.dataIndex,
});
_self.preSelectMapIndex = params.dataIndex;
});
// 移出区域重新随机选中地图区域,并开启定时器
map.on('globalout', function () {
_self.reSelectMapRandomArea();
_self.startInterval();
});
this.startInterval();
}
} catch (error) {
}
});
},
}
}
</script>
const mapJson={"type":"FeatureCollection","features":[{"type":"Feature","properties":{"adcode":820000,"name":"澳门","center":[113.54909,22.198951],"centroid":[113.566988,22.159307],"childrenNum":8,"level":"province","parent":{"adcode":100000},"subFeatureIndex":33,"acroutes":[100000]},"geometry":{"type":"MultiPolygon","coordinates":[[[[113.554425,22.107489],[113.6037,22.132438],[113.575983,22.194513],[113.558736,22.212244],[113.53841,22.209473],[113.534715,22.174009],[113.554425,22.142416],[113.554425,22.107489]]],[[[113.586453,22.201162],[113.575983,22.201162],[113.575983,22.194513],[113.586453,22.201162]]]]}}]}
export default {mapJson}
<template>
  <div :id="id" :class="className" :style="{ height: height, width: width }" />
</template>

<script>
import tdTheme from './theme.json' // 引入默认主题

export default {
  name: 'echart',
  props: {
    className: {
      type: String,
      default: 'chart'
    },
    id: {
      type: String,
      default: 'chart'
    },
    width: {
      type: String,
      default: '100%'
    },
    height: {
      type: String,
      default: '2.5rem'
    },
    options: {
      type: Object,
      default: ()=>({})
    }
  },
  data () {
    return {
      chart: null
    }
  },
  watch: {
    options: {
      handler (options) {
        // 设置true清空echart缓存
        this.chart.setOption(options, true)
      },
      deep: true
    }
  },
  mounted () {
    this.$echarts.registerTheme('tdTheme', tdTheme); // 覆盖默认主题
    this.initChart();
  },
  beforeDestroy () {
    this.chart.dispose()
    this.chart = null
  },
  methods: {
    initChart () {
      // 初始化echart
      this.chart = this.$echarts.init(this.$el, 'tdTheme')
      this.chart.setOption(this.options, true)
    }
  }
}
</script>
{
  "color": [
    "#2d8cf0",
    "#19be6b",
    "#ff9900",
    "#E46CBB",
    "#9A66E4",
    "#ed3f14"
  ],
  "backgroundColor": "rgba(0,0,0,0)",
  "textStyle": {},
  "title": {
    "textStyle": {
      "color": "#516b91"
    },
    "subtextStyle": {
      "color": "#93b7e3"
    }
  },
  "line": {
    "itemStyle": {
      "normal": {
        "borderWidth": "2"
      }
    },
    "lineStyle": {
      "normal": {
        "width": "2"
      }
    },
    "symbolSize": "6",
    "symbol": "emptyCircle",
    "smooth": true
  },
  "radar": {
    "itemStyle": {
      "normal": {
        "borderWidth": "2"
      }
    },
    "lineStyle": {
      "normal": {
        "width": "2"
      }
    },
    "symbolSize": "6",
    "symbol": "emptyCircle",
    "smooth": true
  },
  "bar": {
    "itemStyle": {
      "normal": {
        "barBorderWidth": 0,
        "barBorderColor": "#ccc"
      },
      "emphasis": {
        "barBorderWidth": 0,
        "barBorderColor": "#ccc"
      }
    }
  },
  "pie": {
    "itemStyle": {
      "normal": {
        "borderWidth": 0,
        "borderColor": "#ccc"
      },
      "emphasis": {
        "borderWidth": 0,
        "borderColor": "#ccc"
      }
    }
  },
  "scatter": {
    "itemStyle": {
      "normal": {
        "borderWidth": 0,
        "borderColor": "#ccc"
      },
      "emphasis": {
        "borderWidth": 0,
        "borderColor": "#ccc"
      }
    }
  },
  "boxplot": {
    "itemStyle": {
      "normal": {
        "borderWidth": 0,
        "borderColor": "#ccc"
      },
      "emphasis": {
        "borderWidth": 0,
        "borderColor": "#ccc"
      }
    }
  },
  "parallel": {
    "itemStyle": {
      "normal": {
        "borderWidth": 0,
        "borderColor": "#ccc"
      },
      "emphasis": {
        "borderWidth": 0,
        "borderColor": "#ccc"
      }
    }
  },
  "sankey": {
    "itemStyle": {
      "normal": {
        "borderWidth": 0,
        "borderColor": "#ccc"
      },
      "emphasis": {
        "borderWidth": 0,
        "borderColor": "#ccc"
      }
    }
  },
  "funnel": {
    "itemStyle": {
      "normal": {
        "borderWidth": 0,
        "borderColor": "#ccc"
      },
      "emphasis": {
        "borderWidth": 0,
        "borderColor": "#ccc"
      }
    }
  },
  "gauge": {
    "itemStyle": {
      "normal": {
        "borderWidth": 0,
        "borderColor": "#ccc"
      },
      "emphasis": {
        "borderWidth": 0,
        "borderColor": "#ccc"
      }
    }
  },
  "candlestick": {
    "itemStyle": {
      "normal": {
        "color": "#edafda",
        "color0": "transparent",
        "borderColor": "#d680bc",
        "borderColor0": "#8fd3e8",
        "borderWidth": "2"
      }
    }
  },
  "graph": {
    "itemStyle": {
      "normal": {
        "borderWidth": 0,
        "borderColor": "#ccc"
      }
    },
    "lineStyle": {
      "normal": {
        "width": 1,
        "color": "#aaa"
      }
    },
    "symbolSize": "6",
    "symbol": "emptyCircle",
    "smooth": true,
    "color": [
      "#2d8cf0",
      "#19be6b",
      "#f5ae4a",
      "#9189d5",
      "#56cae2",
      "#cbb0e3"
    ],
    "label": {
      "normal": {
        "textStyle": {
          "color": "#eee"
        }
      }
    }
  },
  "map": {
    "itemStyle": {
      "normal": {
        "areaColor": "#f3f3f3",
        "borderColor": "#516b91",
        "borderWidth": 0.5
      },
      "emphasis": {
        "areaColor": "rgba(165,231,240,1)",
        "borderColor": "#516b91",
        "borderWidth": 1
      }
    },
    "label": {
      "normal": {
        "textStyle": {
          "color": "#000"
        }
      },
      "emphasis": {
        "textStyle": {
          "color": "rgb(81,107,145)"
        }
      }
    }
  },
  "geo": {
    "itemStyle": {
      "normal": {
        "areaColor": "#f3f3f3",
        "borderColor": "#516b91",
        "borderWidth": 0.5
      },
      "emphasis": {
        "areaColor": "rgba(165,231,240,1)",
        "borderColor": "#516b91",
        "borderWidth": 1
      }
    },
    "label": {
      "normal": {
        "textStyle": {
          "color": "#000"
        }
      },
      "emphasis": {
        "textStyle": {
          "color": "rgb(81,107,145)"
        }
      }
    }
  },
  "categoryAxis": {
    "axisLine": {
      "show": true,
      "lineStyle": {
        "color": "#cccccc"
      }
    },
    "axisTick": {
      "show": false,
      "lineStyle": {
        "color": "#333"
      }
    },
    "axisLabel": {
      "show": true,
      "textStyle": {
        "color": "#fff"
      }
    },
    "splitLine": {
      "show": false,
      "lineStyle": {
        "color": [
          "#eeeeee"
        ]
      }
    },
    "splitArea": {
      "show": false,
      "areaStyle": {
        "color": [
          "rgba(250,250,250,0.05)",
          "rgba(200,200,200,0.02)"
        ]
      }
    }
  },
  "valueAxis": {
    "axisLine": {
      "show": true,
      "lineStyle": {
        "color": "#cccccc"
      }
    },
    "axisTick": {
      "show": false,
      "lineStyle": {
        "color": "#333"
      }
    },
    "axisLabel": {
      "show": true,
      "textStyle": {
        "color": "#fff"
      }
    },
    "splitLine": {
      "show": false,
      "lineStyle": {
        "color": [
          "#eeeeee"
        ]
      }
    },
    "splitArea": {
      "show": false,
      "areaStyle": {
        "color": [
          "rgba(250,250,250,0.05)",
          "rgba(200,200,200,0.02)"
        ]
      }
    }
  },
  "logAxis": {
    "axisLine": {
      "show": true,
      "lineStyle": {
        "color": "#cccccc"
      }
    },
    "axisTick": {
      "show": false,
      "lineStyle": {
        "color": "#333"
      }
    },
    "axisLabel": {
      "show": true,
      "textStyle": {
        "color": "#999999"
      }
    },
    "splitLine": {
      "show": true,
      "lineStyle": {
        "color": [
          "#eeeeee"
        ]
      }
    },
    "splitArea": {
      "show": false,
      "areaStyle": {
        "color": [
          "rgba(250,250,250,0.05)",
          "rgba(200,200,200,0.02)"
        ]
      }
    }
  },
  "timeAxis": {
    "axisLine": {
      "show": true,
      "lineStyle": {
        "color": "#cccccc"
      }
    },
    "axisTick": {
      "show": false,
      "lineStyle": {
        "color": "#333"
      }
    },
    "axisLabel": {
      "show": true,
      "textStyle": {
        "color": "#999999"
      }
    },
    "splitLine": {
      "show": true,
      "lineStyle": {
        "color": [
          "#eeeeee"
        ]
      }
    },
    "splitArea": {
      "show": false,
      "areaStyle": {
        "color": [
          "rgba(250,250,250,0.05)",
          "rgba(200,200,200,0.02)"
        ]
      }
    }
  },
  "toolbox": {
    "iconStyle": {
      "normal": {
        "borderColor": "#999"
      },
      "emphasis": {
        "borderColor": "#666"
      }
    }
  },
  "legend": {
    "textStyle": {
      "color": "#fff"
    }
  },
  "tooltip": {
    "axisPointer": {
      "lineStyle": {
        "color": "#ccc",
        "width": 1
      },
      "crossStyle": {
        "color": "#ccc",
        "width": 1
      }
    }
  },
  "timeline": {
    "lineStyle": {
      "color": "#8fd3e8",
      "width": 1
    },
    "itemStyle": {
      "normal": {
        "color": "#8fd3e8",
        "borderWidth": 1
      },
      "emphasis": {
        "color": "#8fd3e8"
      }
    },
    "controlStyle": {
      "normal": {
        "color": "#8fd3e8",
        "borderColor": "#8fd3e8",
        "borderWidth": 0.5
      },
      "emphasis": {
        "color": "#8fd3e8",
        "borderColor": "#8fd3e8",
        "borderWidth": 0.5
      }
    },
    "checkpointStyle": {
      "color": "#8fd3e8",
      "borderColor": "rgba(138,124,168,0.37)"
    },
    "label": {
      "normal": {
        "textStyle": {
          "color": "#8fd3e8"
        }
      },
      "emphasis": {
        "textStyle": {
          "color": "#8fd3e8"
        }
      }
    }
  },
  "visualMap": {
    "color": [
      "#516b91",
      "#59c4e6",
      "#a5e7f0"
    ]
  },
  "dataZoom": {
    "backgroundColor": "rgba(0,0,0,0)",
    "dataBackgroundColor": "rgba(255,255,255,0.3)",
    "fillerColor": "rgba(167,183,204,0.4)",
    "handleColor": "#a7b7cc",
    "handleSize": "100%",
    "textStyle": {
      "color": "#333"
    }
  },
  "markPoint": {
    "label": {
      "normal": {
        "textStyle": {
          "color": "#eee"
        }
      },
      "emphasis": {
        "textStyle": {
          "color": "#eee"
        }
      }
    }
  }
}
main.js
// 按需引入vue-awesome图标
import Icon from 'vue-awesome/components/Icon';
import 'vue-awesome/icons/map.js';
import dataV from '@jiaminghi/data-view';
import Echart from './common/echart/index.vue'
// 全局注册
Vue.component('icon', Icon);
Vue.component("Echart", Echart)
Vue.use(dataV);

//引入echart
//4.x 引用方式
//import echarts from 'echarts';
//5.x 引用方式为按需引用
//希望使用5.x版本的话,需要在package.json中更新版本号,并切换引用方式
import * as echarts from 'echarts'  //本例使用的是^5.4.0版本
Vue.prototype.$echarts = echarts
原文地址:https://blog.csdn.net/tiantang_1986/article/details/128490749
本文来自互联网用户投稿,该文观点仅代表作者本人,不代表本站立场。本站仅提供信息存储空间服务,不拥有所有权,不承担相关法律责任。
如若转载,请注明出处:http://www.7code.cn/show_8846.html
如若内容造成侵权/违法违规/事实不符,请联系代码007邮箱:suwngjj01@126.com进行投诉反馈,一经查实,立即删除!
声明:本站所有文章,如无特殊说明或标注,均为本站原创发布。任何个人或组织,在未征得本站同意时,禁止复制、盗用、采集、发布本站内容到任何网站、书籍等各类媒体平台。如若本站内容侵犯了原著者的合法权益,可联系我们进行处理。